mapping-4-1
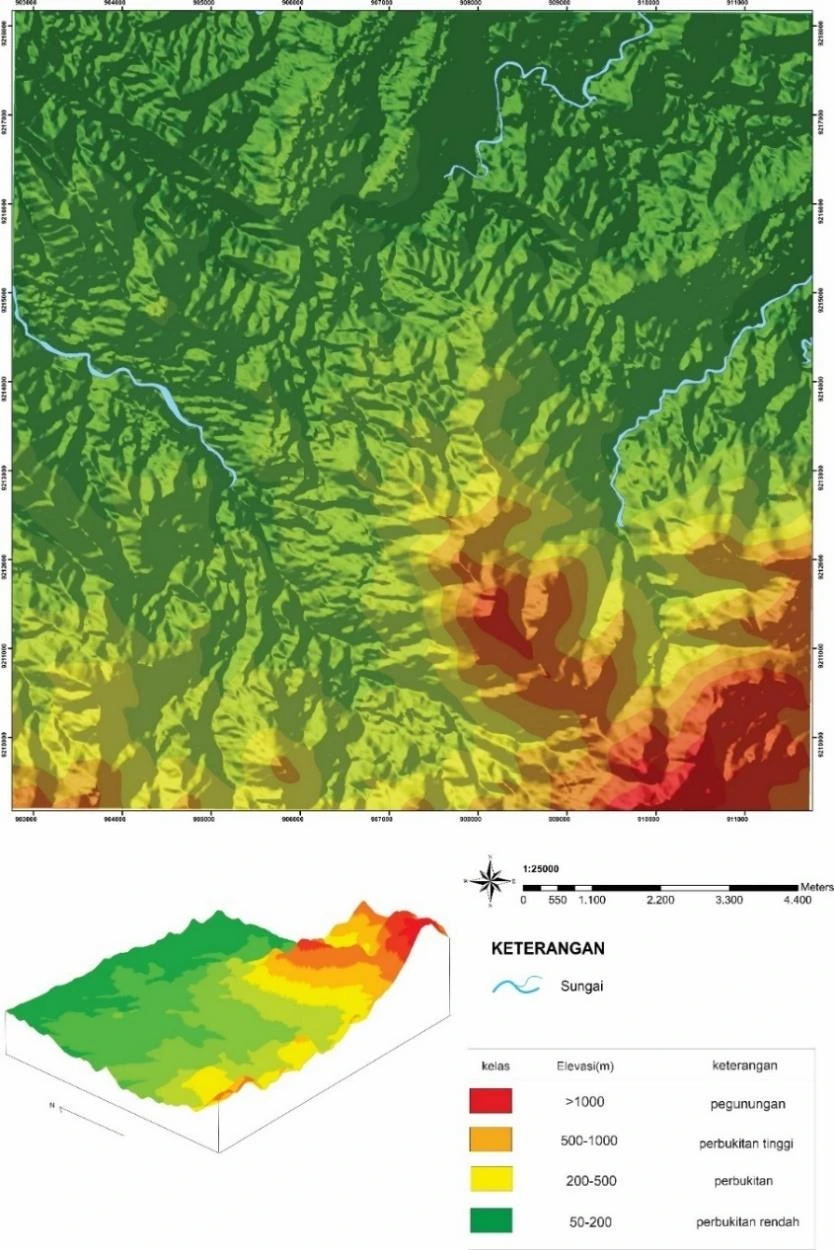
Geomorphology base map
The elevation model establishes the first-order physiographic boundary conditions of the 81 km² survey, but elevation alone cannot discriminate lithology or structure.
ALBUM
All 41 records are shown below.
The elevation model establishes the first-order physiographic boundary conditions of the 81 km² survey, but elevation alone cannot discriminate lithology or structure.
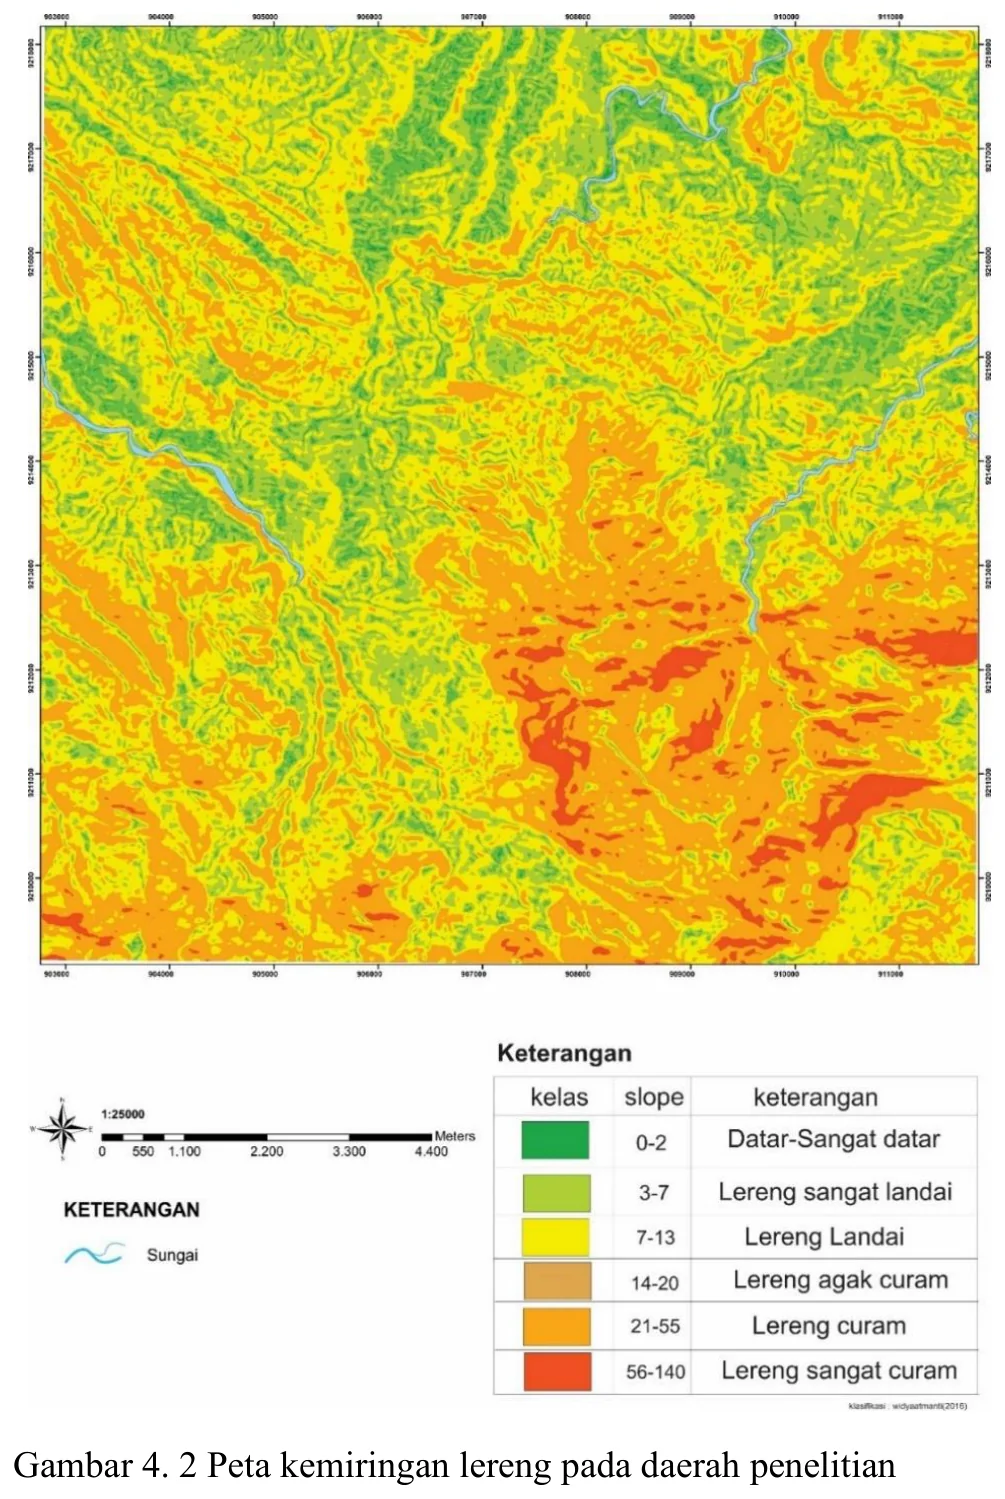
The slope product converts topography into a process-sensitive surface that can support terrain segmentation, traverse planning and first-pass instability screening.
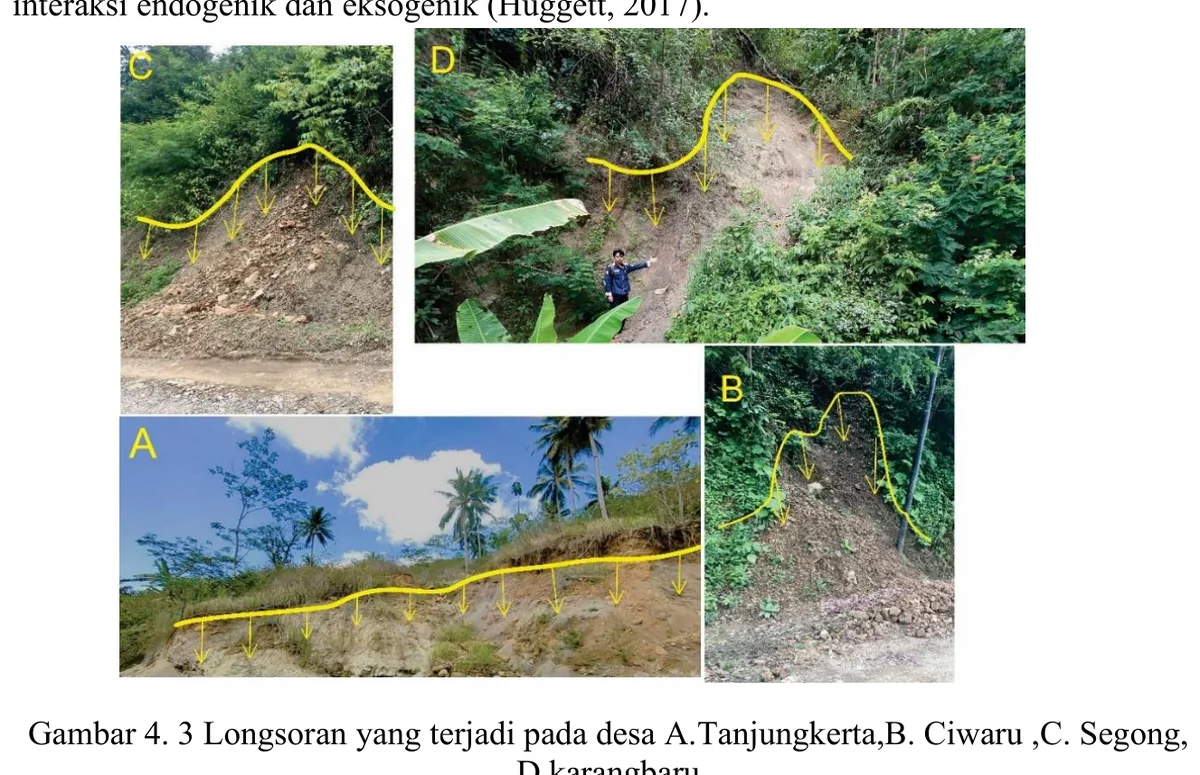
The landslide montage confirms that slope failure occurred at several mapped localities and provides valuable scale, material and morphological context, yet photographs alone cannot establish a regional causal mechanism.
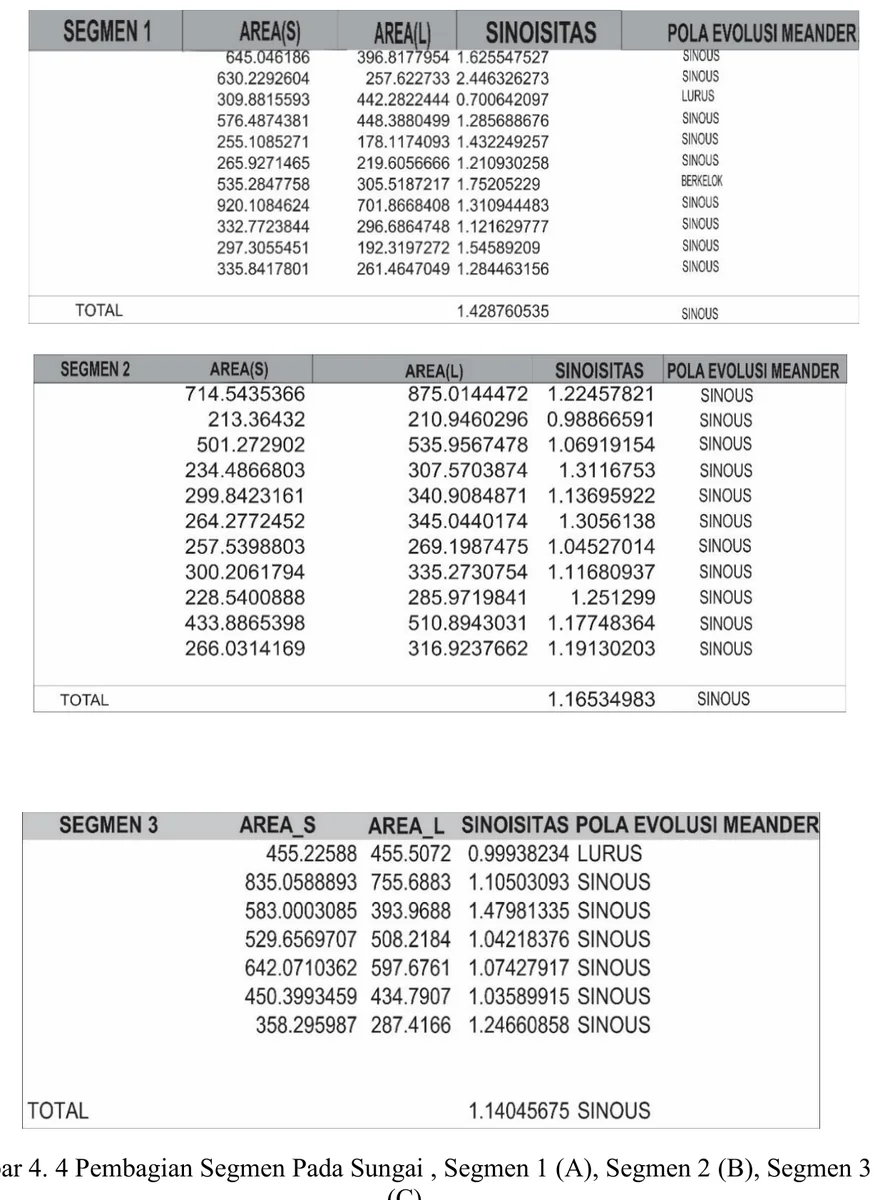
The river segmentation is useful if the reaches were divided by reproducible changes in gradient, confinement, sinuosity, substrate, tributary junctions or valley-floor width rather than by visual convenience.
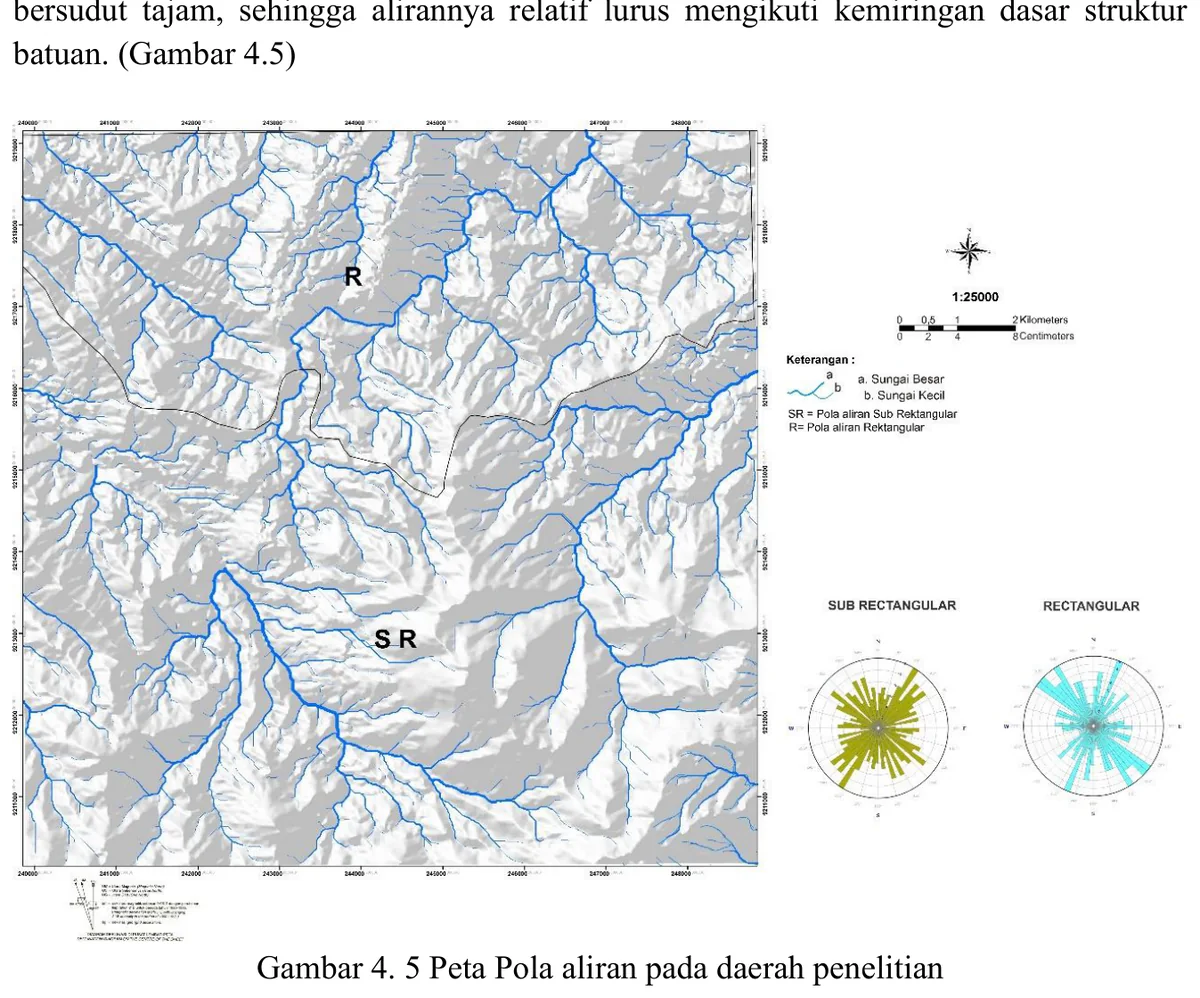
Drainage organisation records the integrated response of substrate, relief, runoff and geological discontinuities, so the map is best treated as convergent rather than diagnostic evidence.
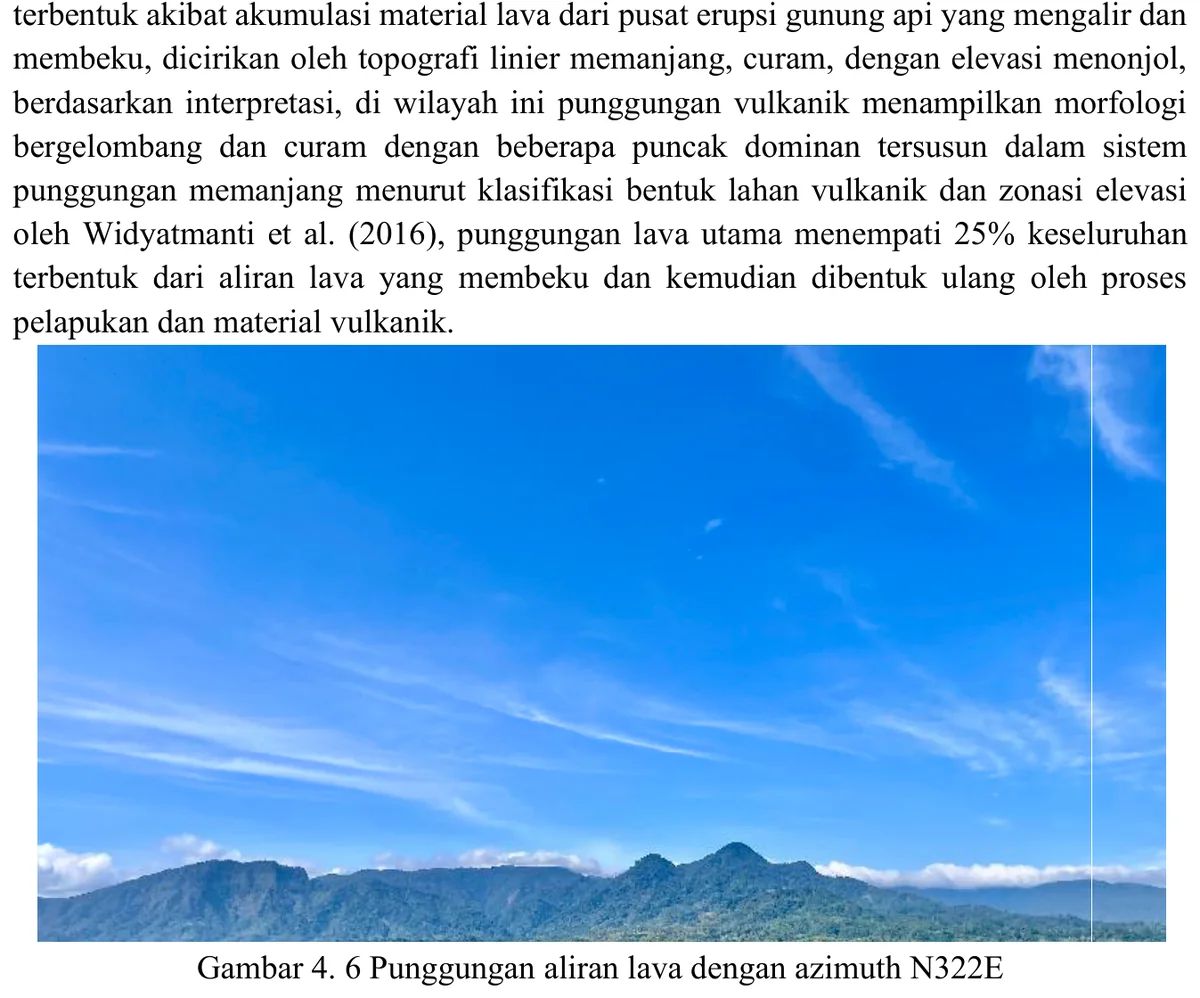
The elongated ridge is consistent with a resistant volcanic or volcaniclastic substrate, but morphology cannot uniquely identify a lava-controlled landform.
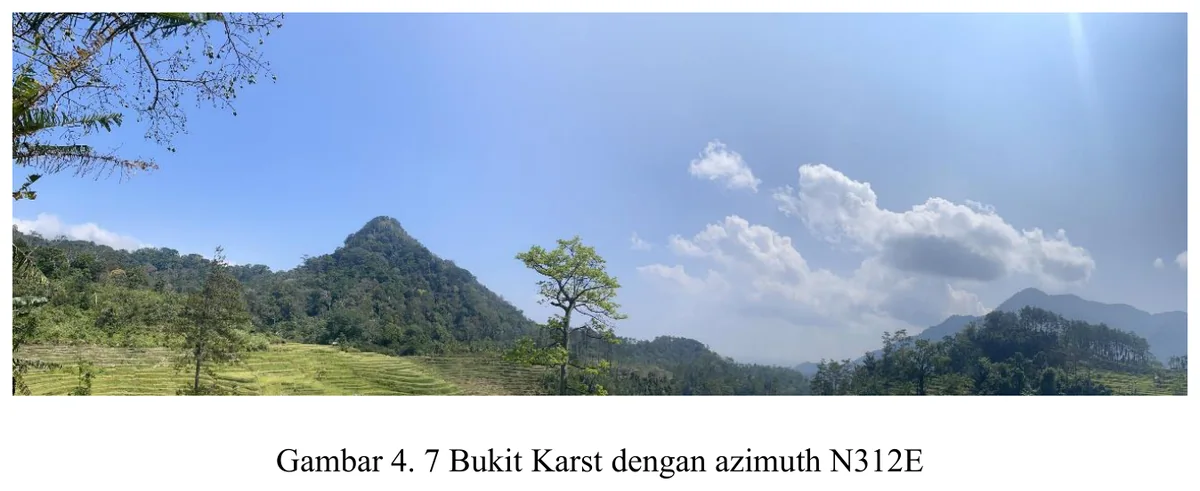
The steep-sided residual hill is morphologically compatible with karst developed in carbonate rock, especially when considered with the mapped limestone and cave photographs, yet conical form alone is not sufficient.
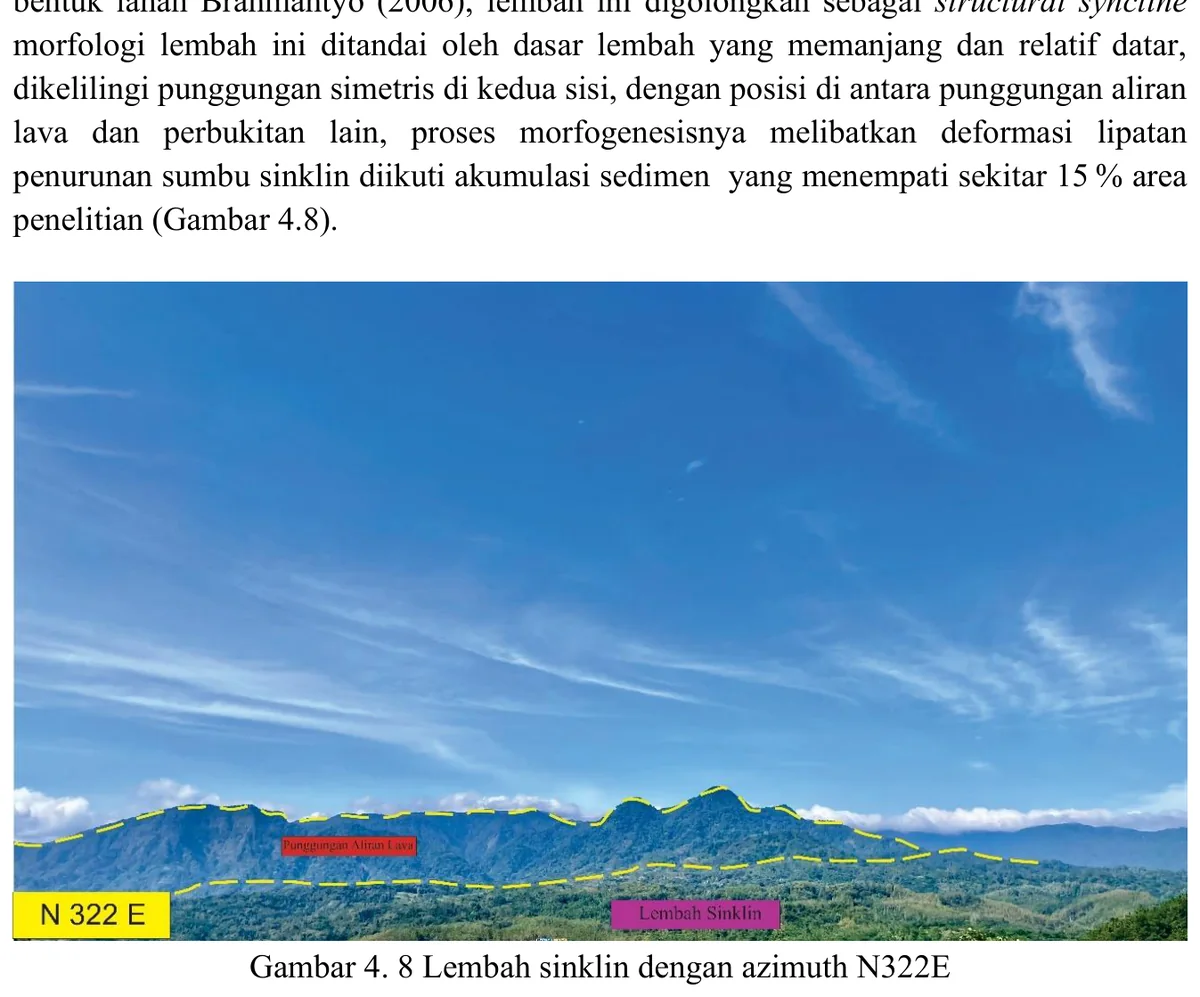
A valley positioned over a mapped synclinal domain is a plausible example of structural inversion in which erosion preferentially follows weaker or more fractured core strata, but the photograph cannot demonstrate synclinal geometry.
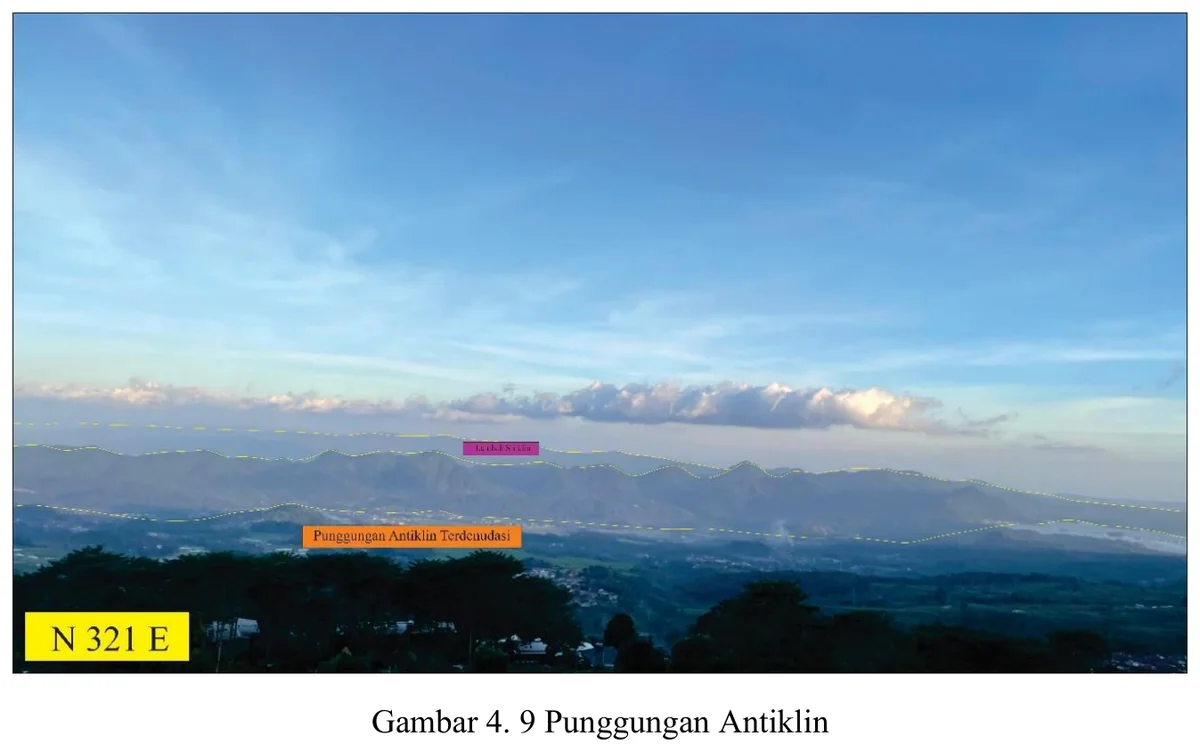
The ridge aligned with the interpreted anticline is consistent with a resistant bed exposed around a folded structural high, but positive relief is not direct proof of an anticline.
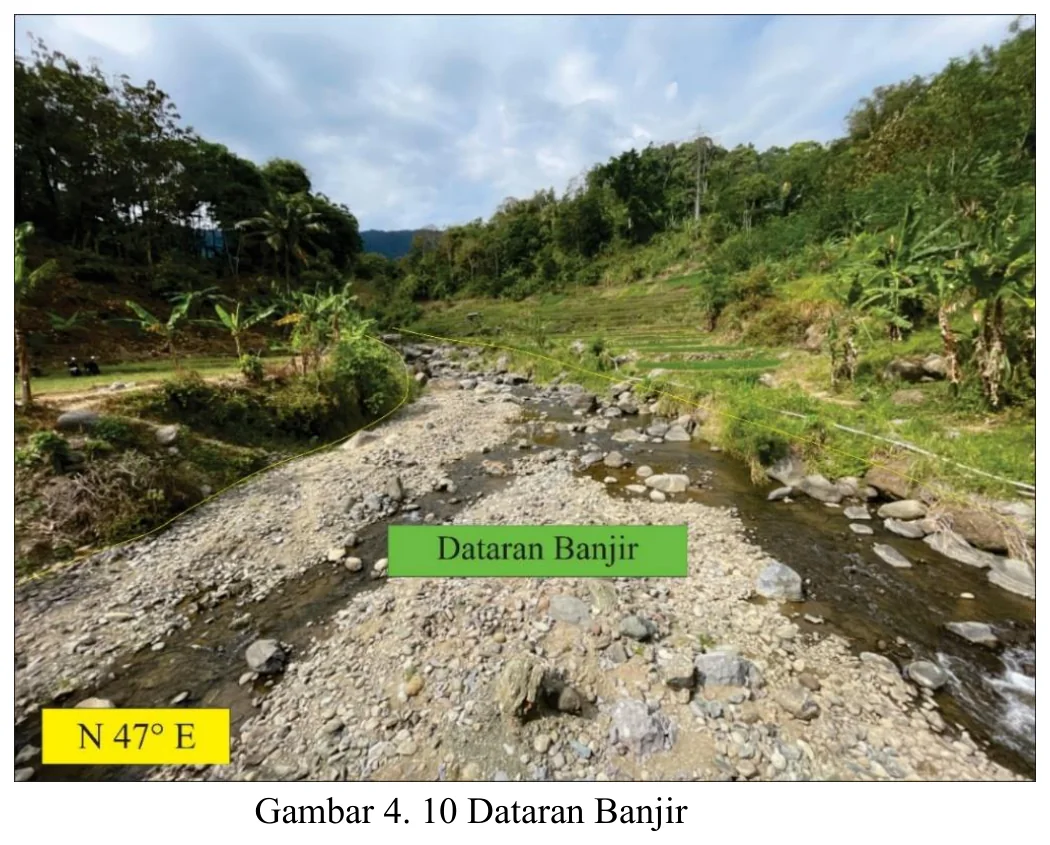
The low-relief surface adjacent to the active channel is compatible with a floodplain, although a single oblique image cannot distinguish active floodplain from a slightly elevated terrace, abandoned channel belt or anthropogenic surface.
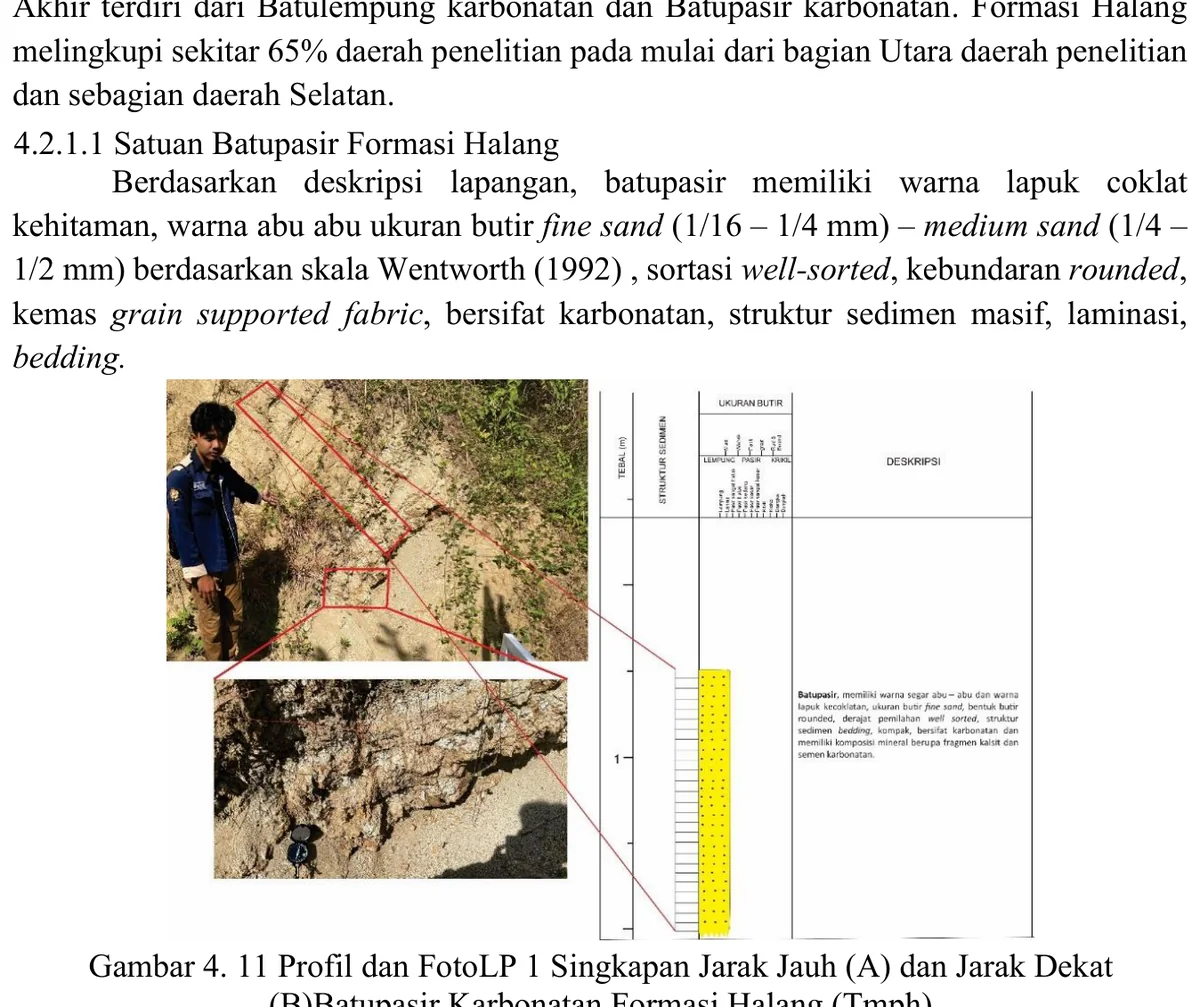
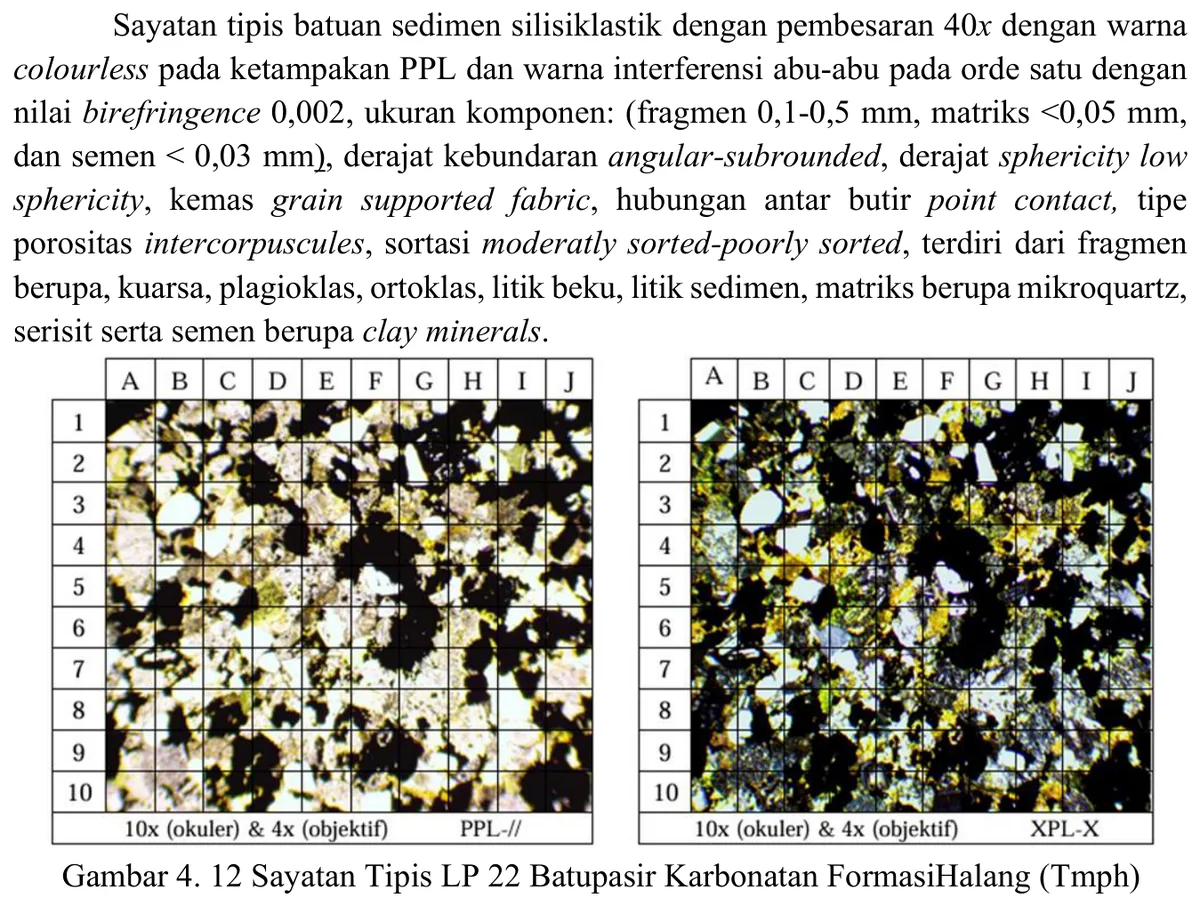
The LP22 thin section can test the mineralogical and textural basis of the sandstone classification, but only if the sample code, field station and image labels are internally consistent.
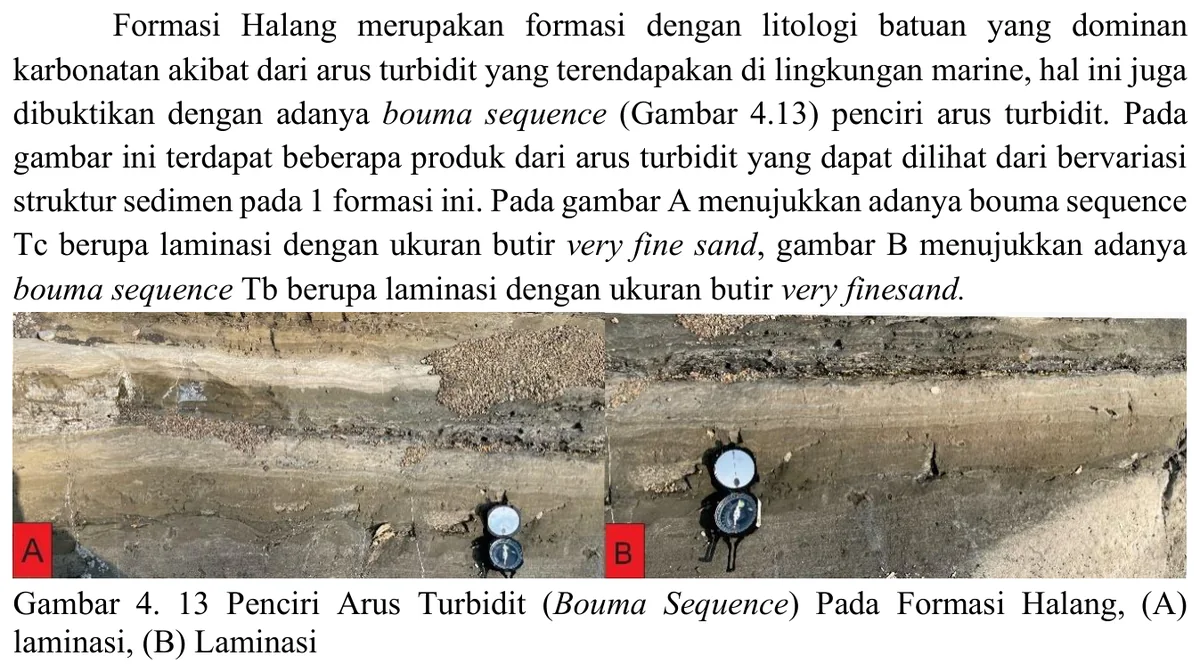
The exposed sandstone beds show parallel lamination and grain-size or weathering contrasts compatible with tractional reworking within a gravity-flow deposit.
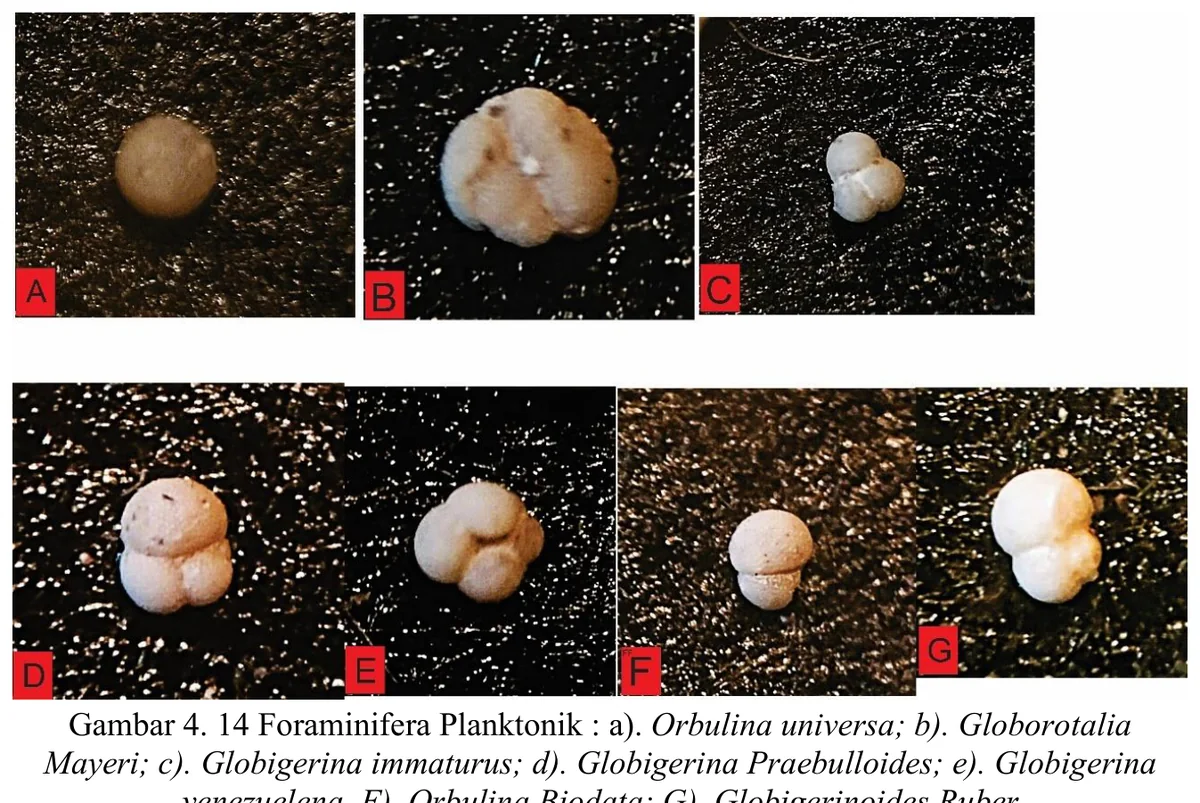
The planktonic foraminiferal plate provides potentially high-value biostratigraphic evidence, but taxonomic confidence depends on preservation, diagnostic views, scale, picking protocol and expert verification.
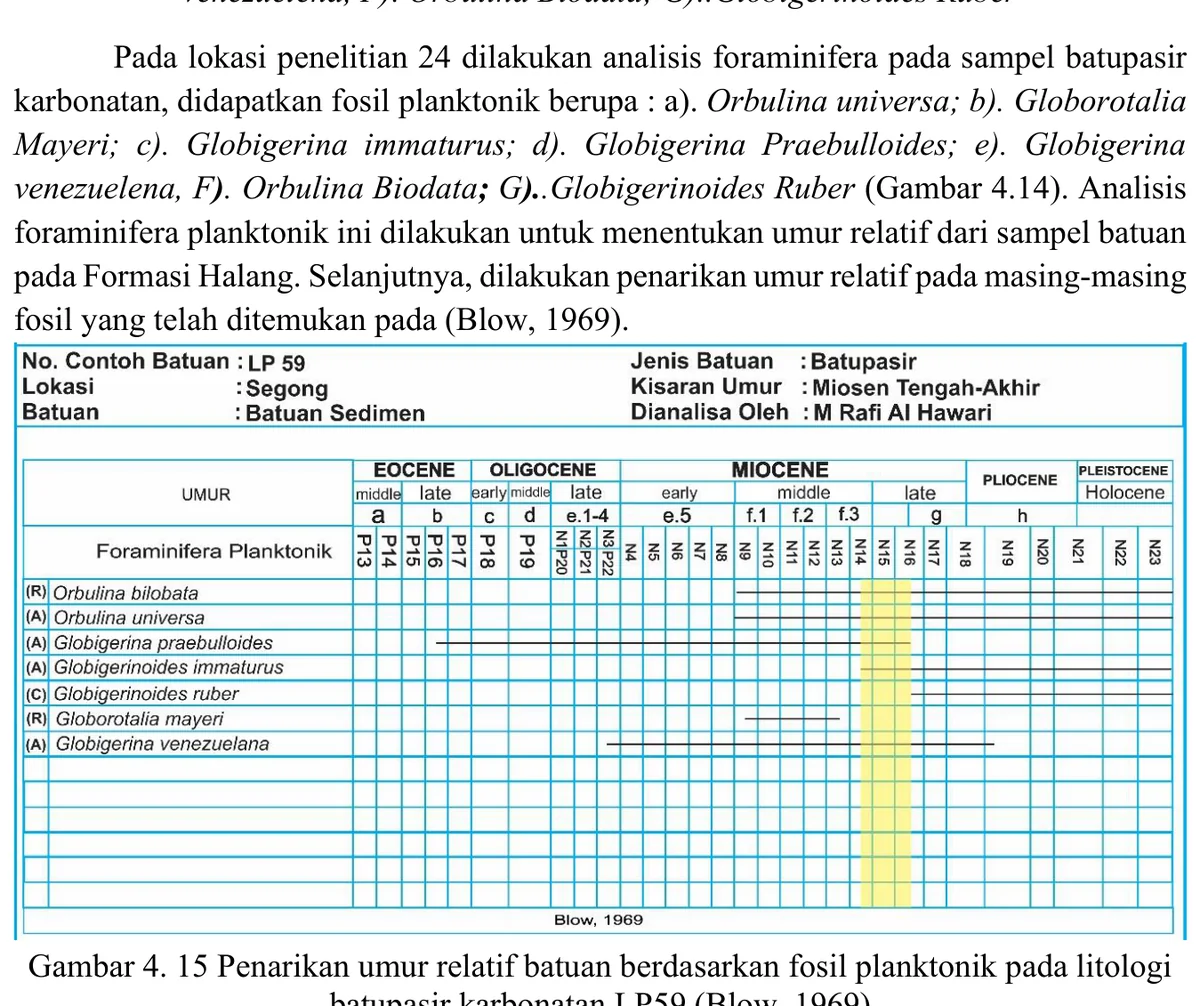
The LP59 range chart is an interpretive calculation rather than new fossil evidence: its reliability cannot exceed the underlying identifications, taxonomic ranges and chosen zonation. Range overlap should document the reference calibration, regional applicability, treatment of uncertain taxa and whether datums represent global, tropical or local bioevents.
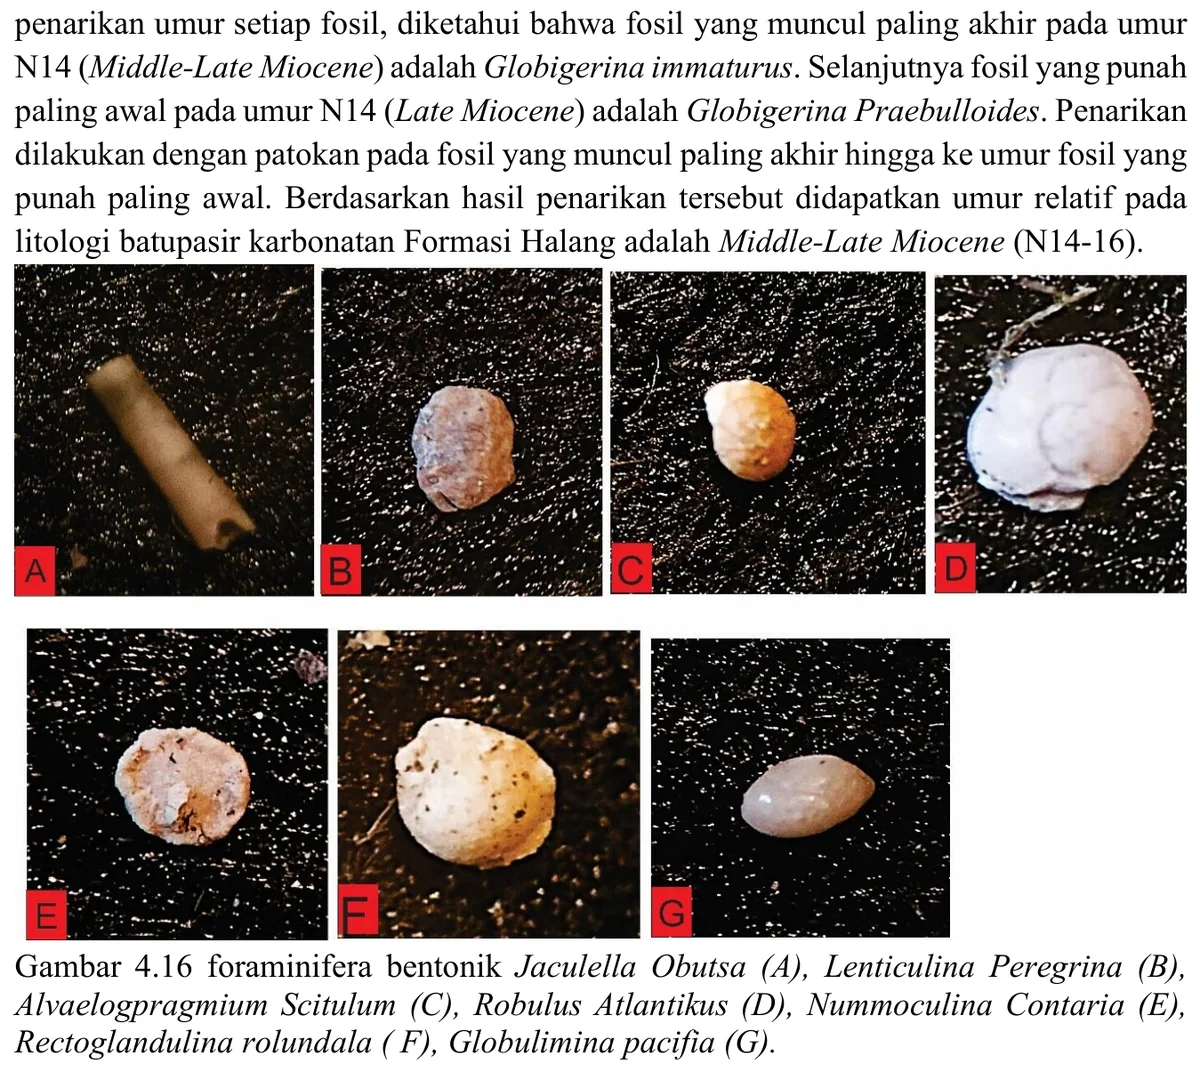
The benthic assemblage is relevant to palaeoenvironment because habitat preferences integrate oxygenation, substrate, food supply and water depth, but no taxon is a mechanical depth gauge.
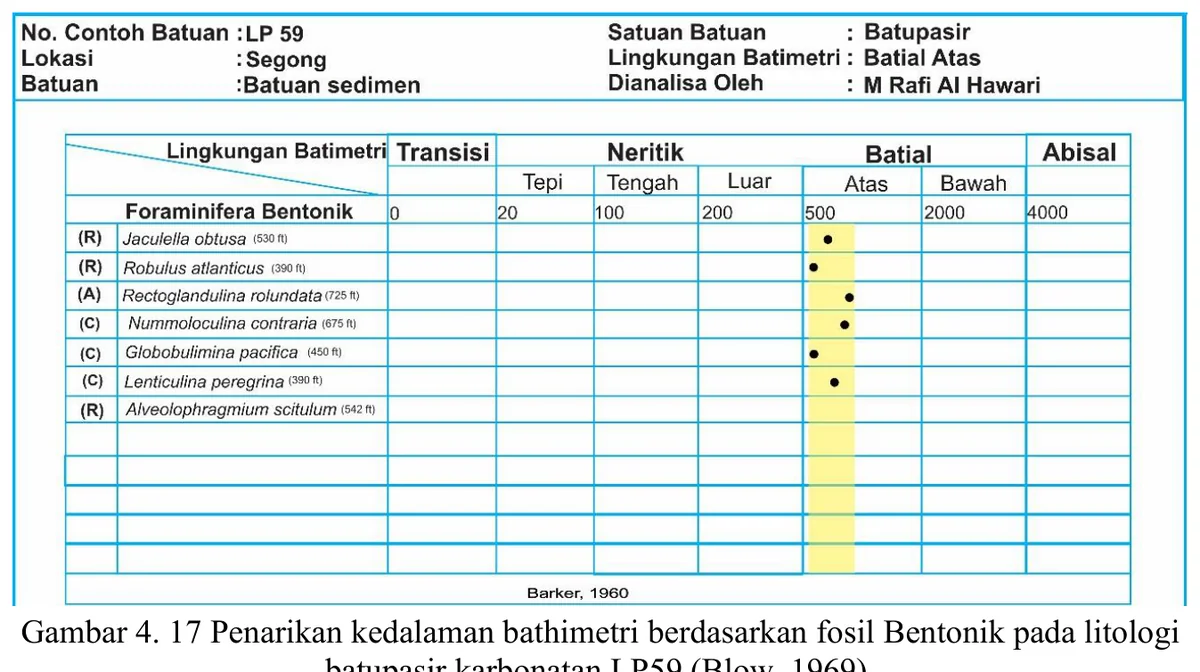
The palaeobathymetric chart synthesises ecological ranges for LP59 and is useful as an auditable bridge between taxonomy and environmental interpretation. Its endpoints should not be read as exact depositional depths because published ranges overlap broadly and respond to oxygen, productivity and substrate as well as depth.
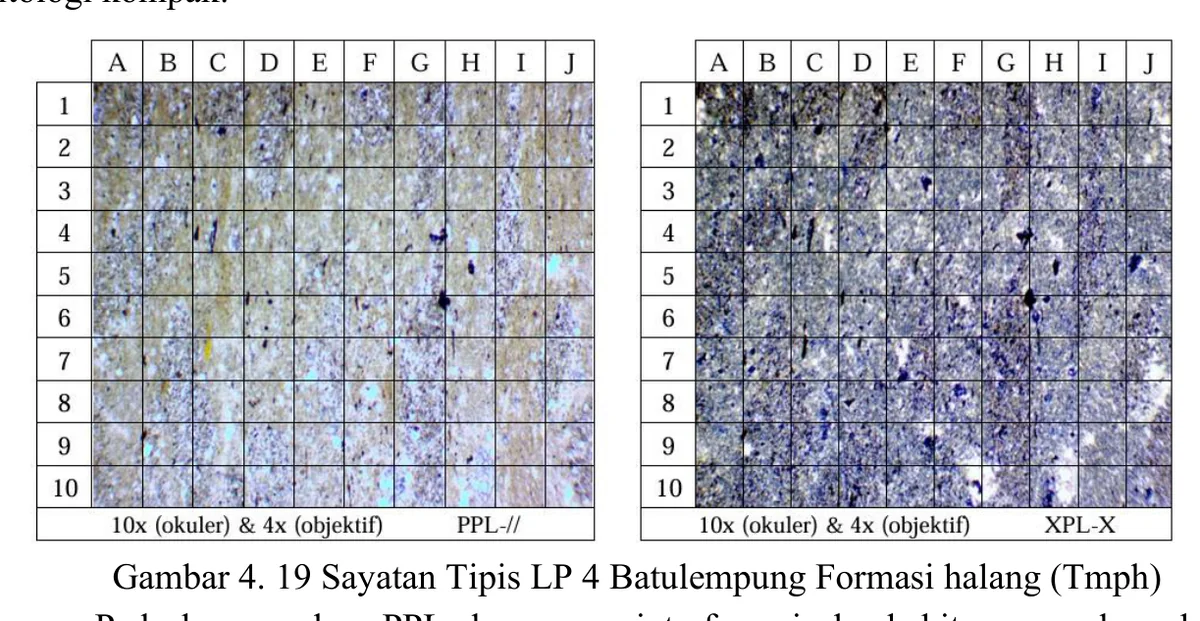
The LP4 thin section can substantiate a clay-rich rock only if imaging resolution and preparation permit matrix, silt grains, carbonate and alteration products to be distinguished.
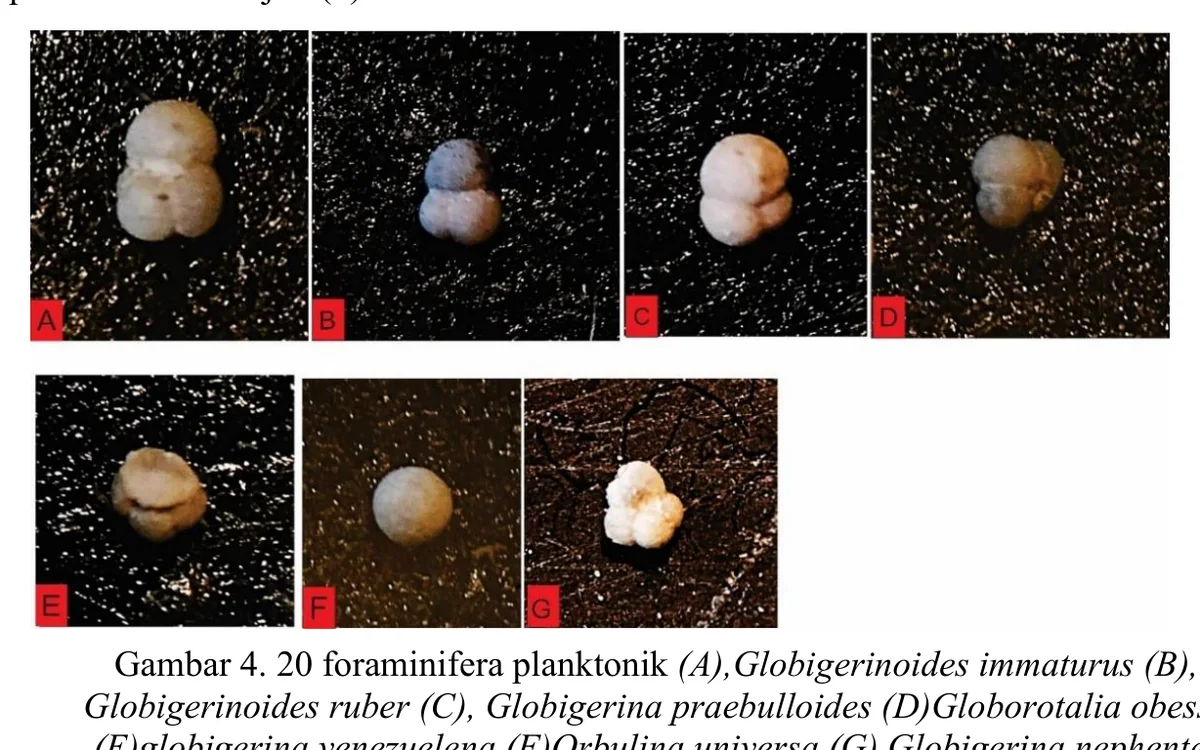
The claystone planktonic assemblage may provide a more nearly depositional age than sandstone-hosted specimens because fine-grained sediment is less likely to contain coarse reworked lag, but reworking and contamination remain possible.
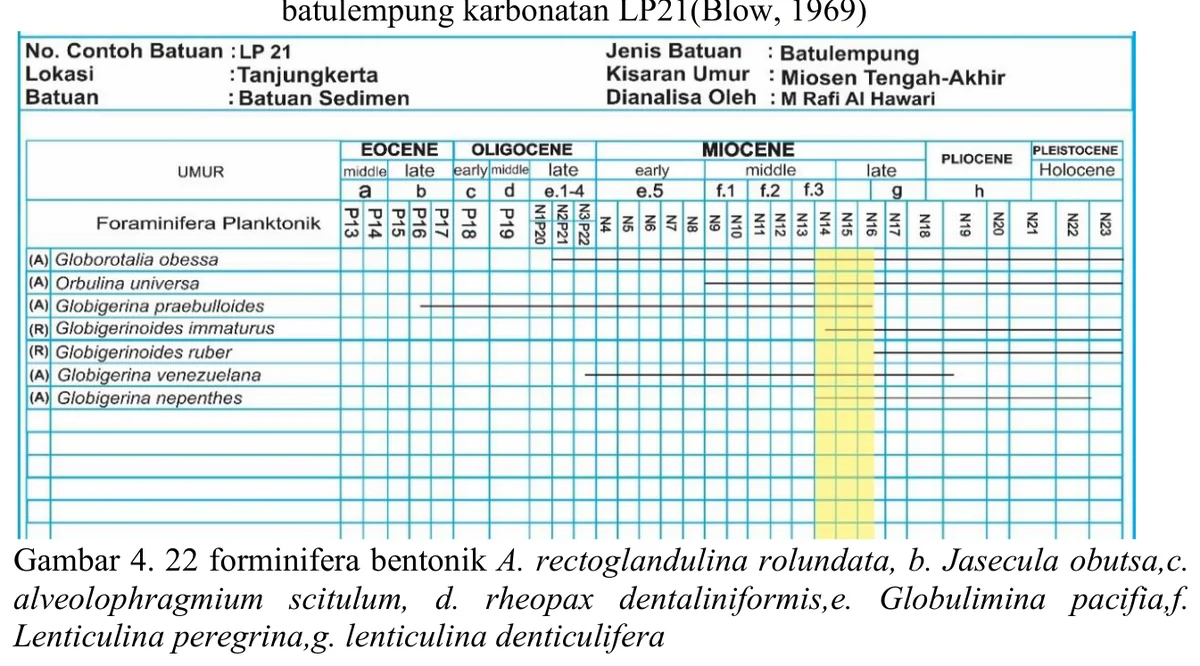
The LP21 range chart should make the inferential chain fully reproducible: specimen identification, published range, selected zonation, overlap interval and final confidence. A zonal conclusion is robust only when multiple diagnostic taxa converge and when the sample’s stratigraphic position is secure.
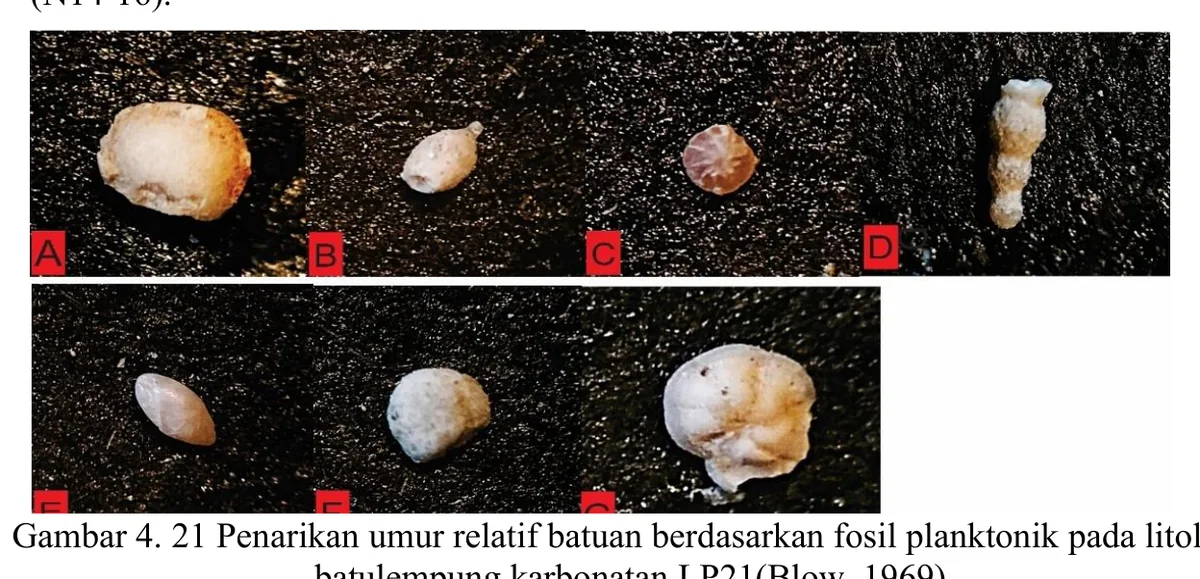
The LP21 benthic plate is an assemblage-level environmental dataset, not a collection of independent depth markers. Relative abundance, diversity, wall composition, preservation and evidence of transport should accompany identifications.
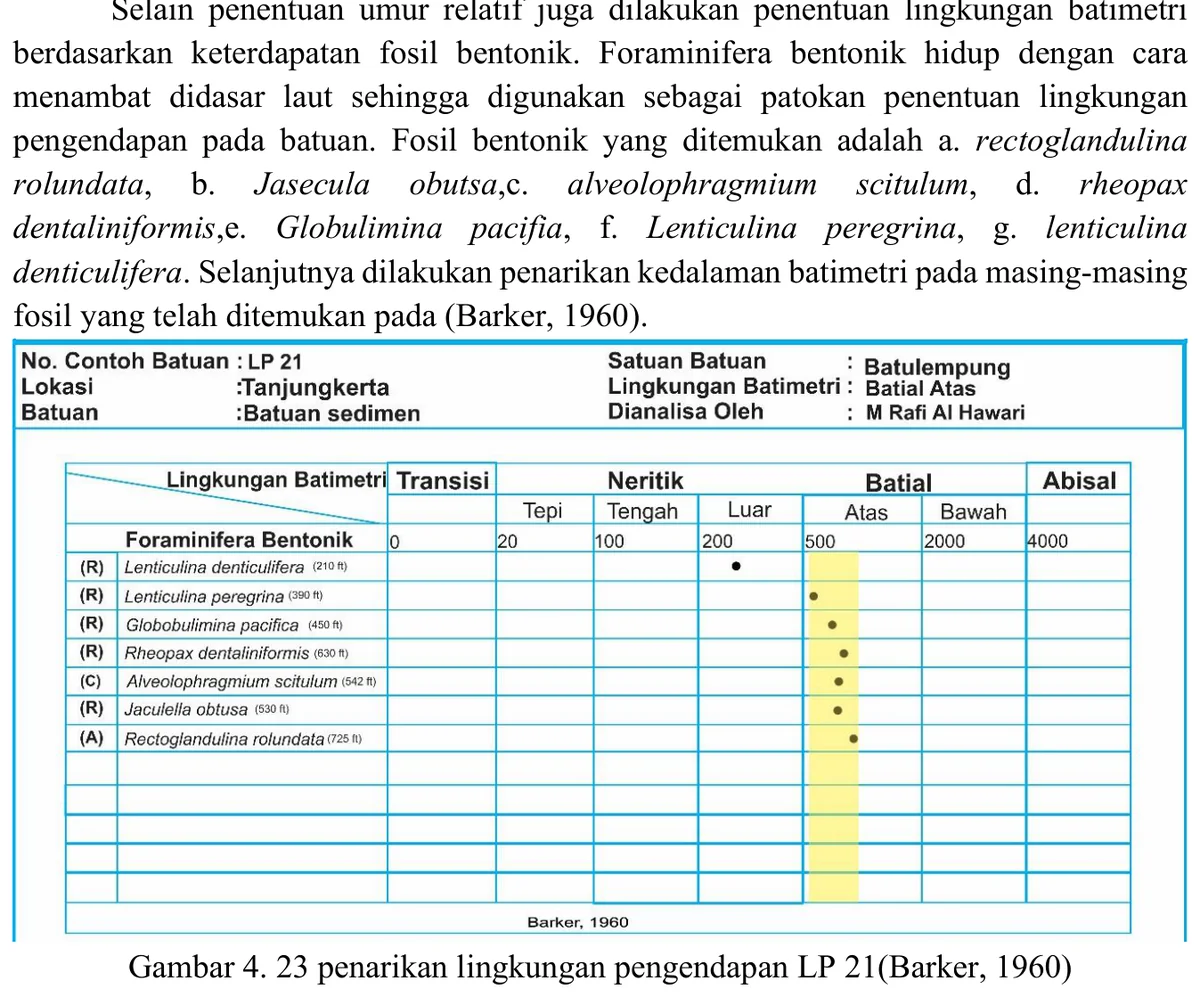
The LP21 depth chart reportedly places the sample in an upper-bathyal envelope, a plausible setting for fine-grained deposits associated with the Halang deep-water system. That conclusion remains conditional on the ecological calibration and preservation of the controlling benthic taxa.
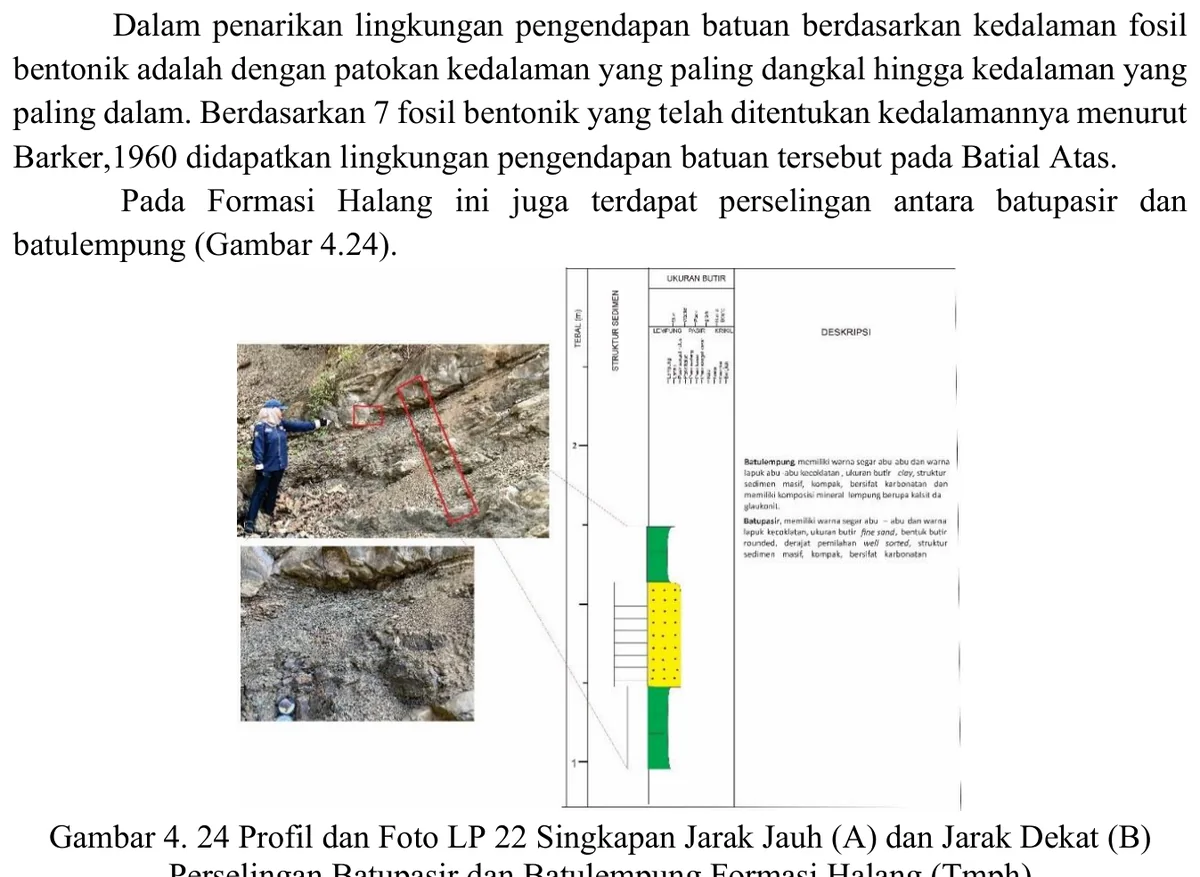
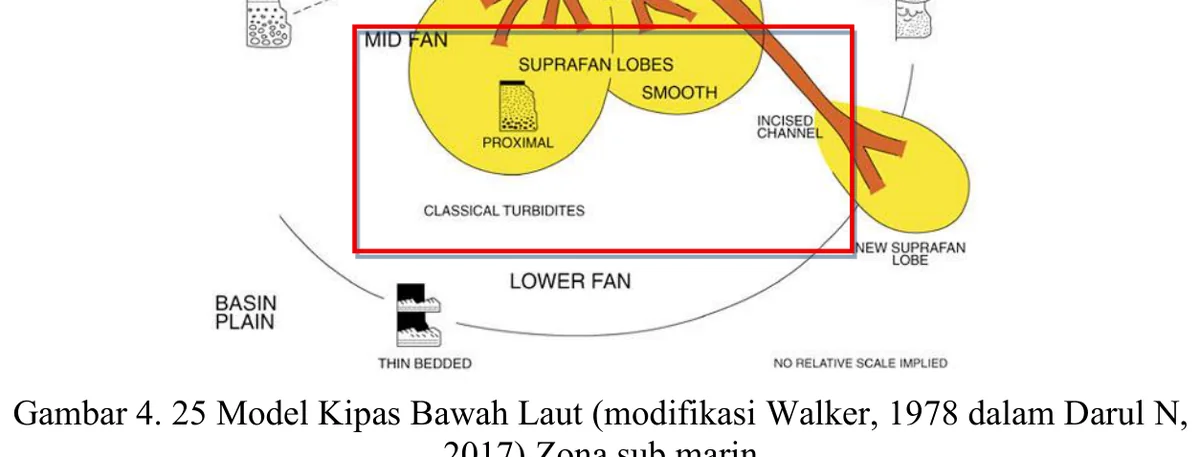
The submarine-fan diagram is a conceptual analogue used to organise observations, not field evidence from Karangkancana.
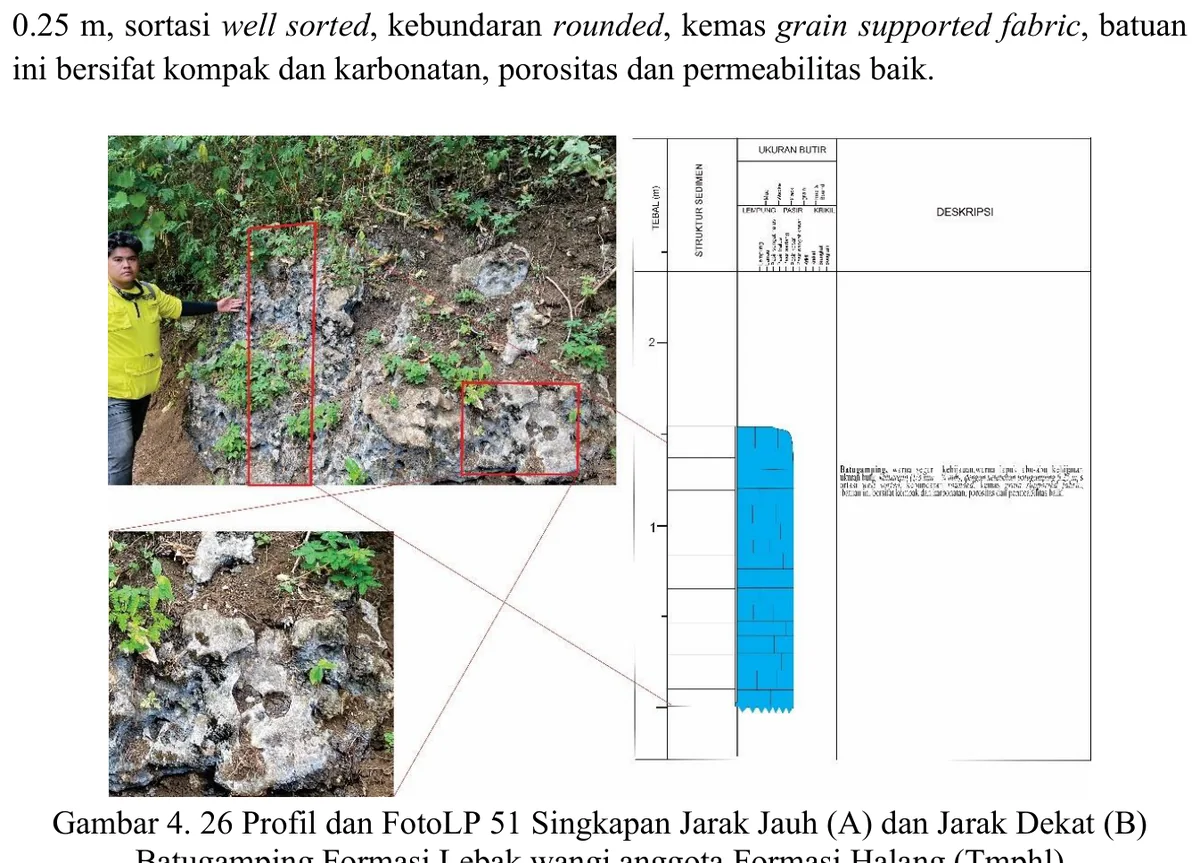
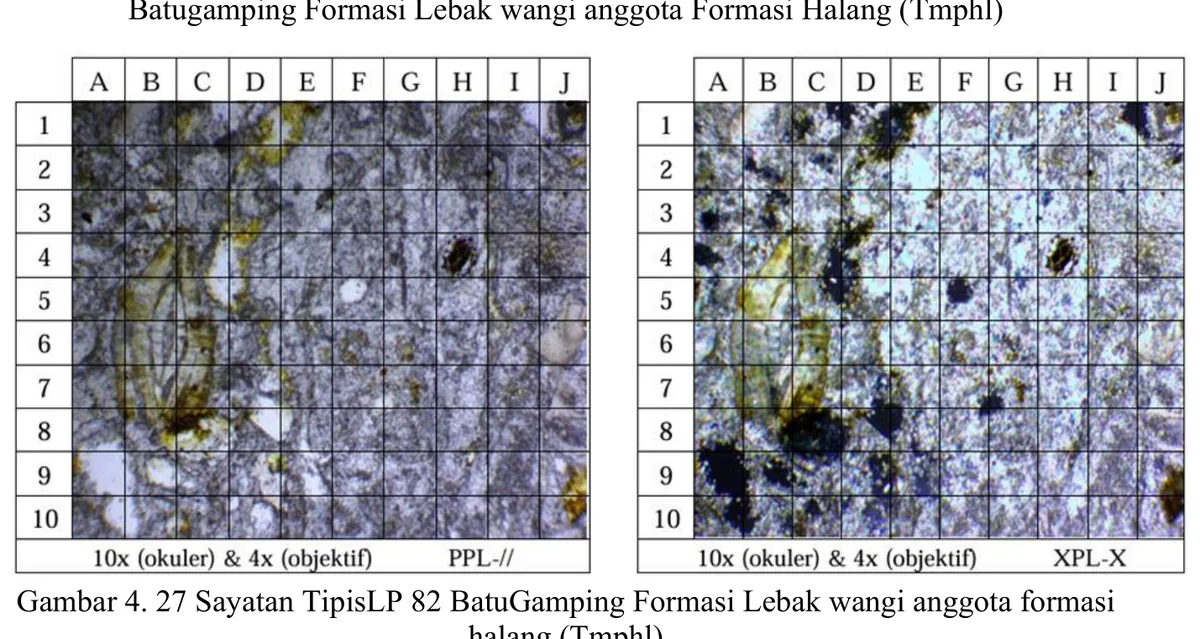
The LP82 carbonate thin section is classified as wackestone, consistent with a matrix-supported fabric containing more than ten percent allochems under the Embry and Klovan framework.
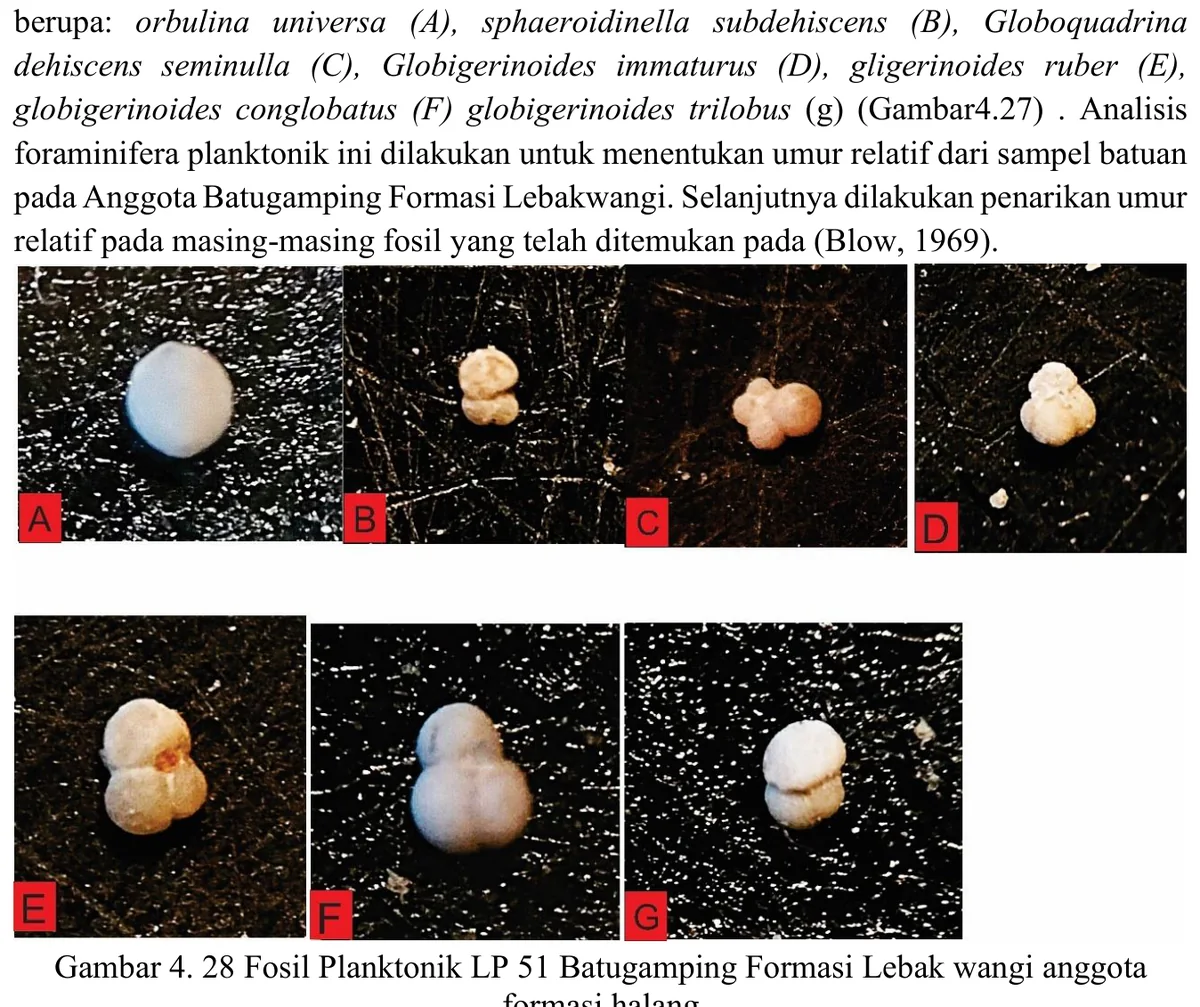
The LP51 planktonic plate is used to date the limestone, yet carbonate samples may contain reworked pelagic tests, diagenetically altered specimens or mixed material introduced through cavities. Identifications should therefore be tied to preservation state, host microfacies and individual views, with contamination and reworking explicitly screened.
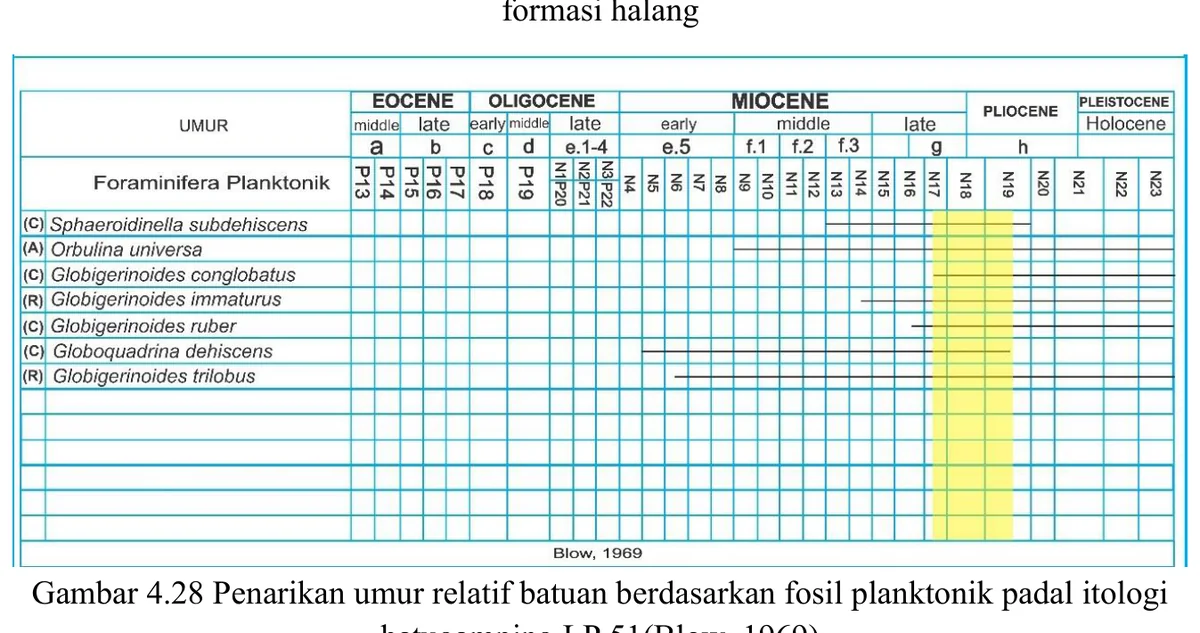
The LP51 range chart reportedly supports an N17–N19 or Late Miocene to Early Pliocene interval, but the precision and nomenclature must be tied to a named zonation and current taxonomic calibration. A broad three-zone range may be scientifically honest if diagnostic overlap is limited; compressing it to a single age would overstate resolution.
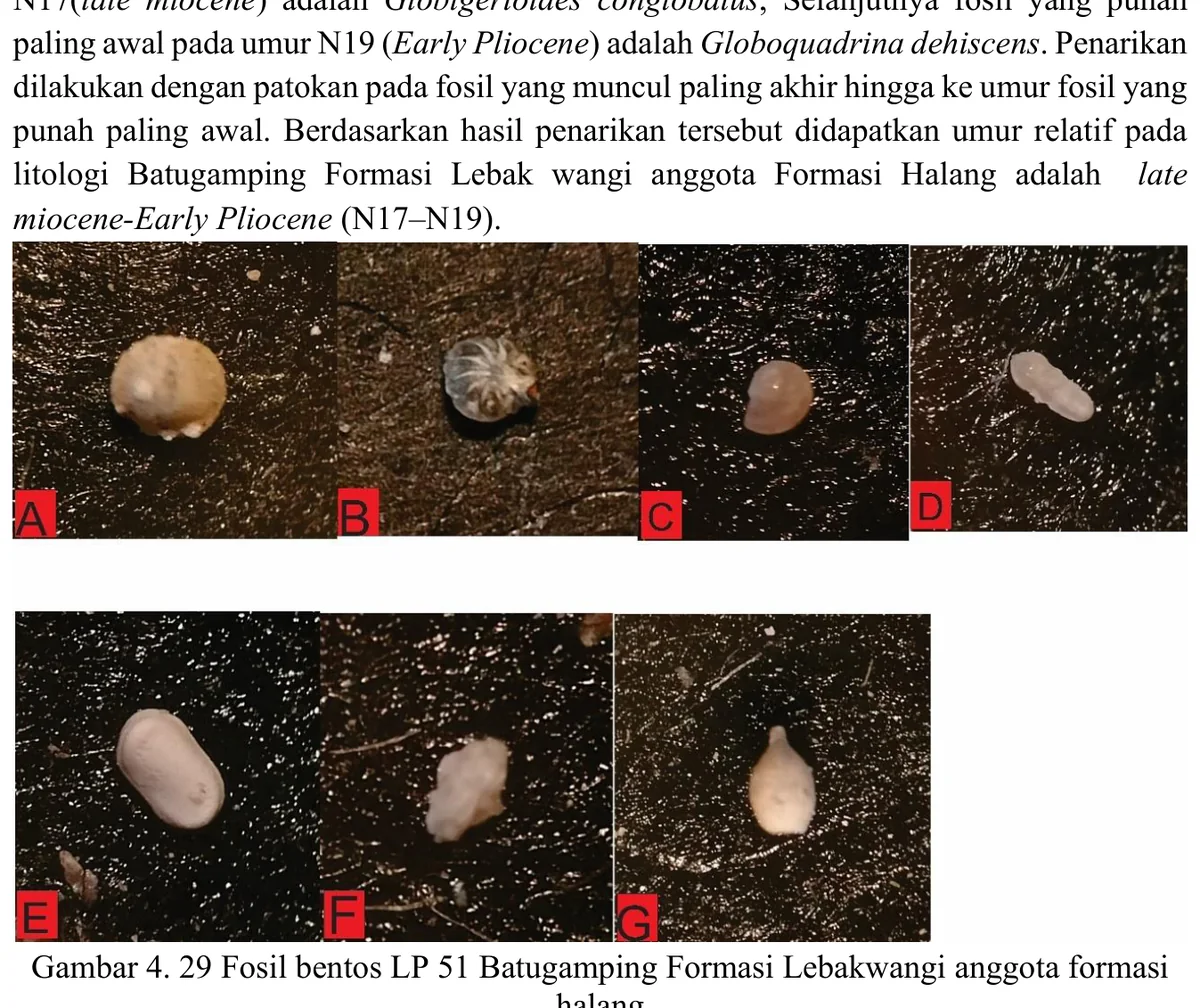
The LP51 benthic assemblage provides environmental context for carbonate deposition, but carbonate-platform, slope and deep-water taxa can coexist through downslope transport. Interpretation should document relative abundance, abrasion, fragmentation, encrustation and matrix association, then separate likely autochthonous from allochthonous components.
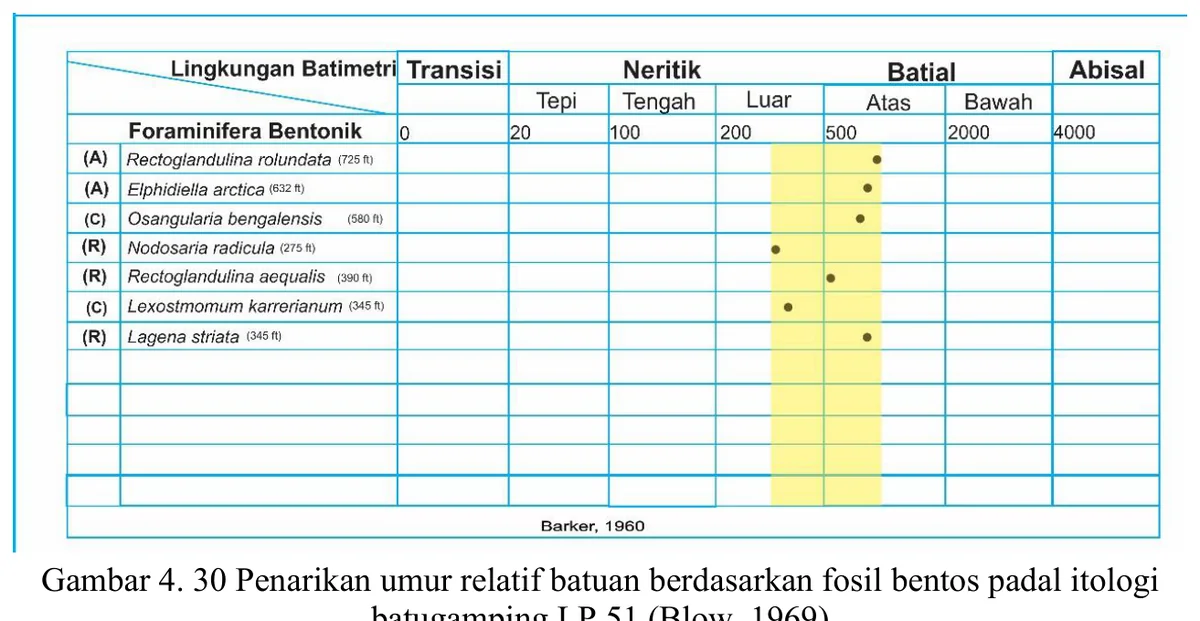
The LP51 palaeobathymetric synthesis is a model output whose uncertainty is inherited from taxonomy, ecological range and transport history. The displayed overlap should be recalculated with abundance weighting and a leave-one-taxon-out test so reviewers can see whether one questionable identification controls the result.
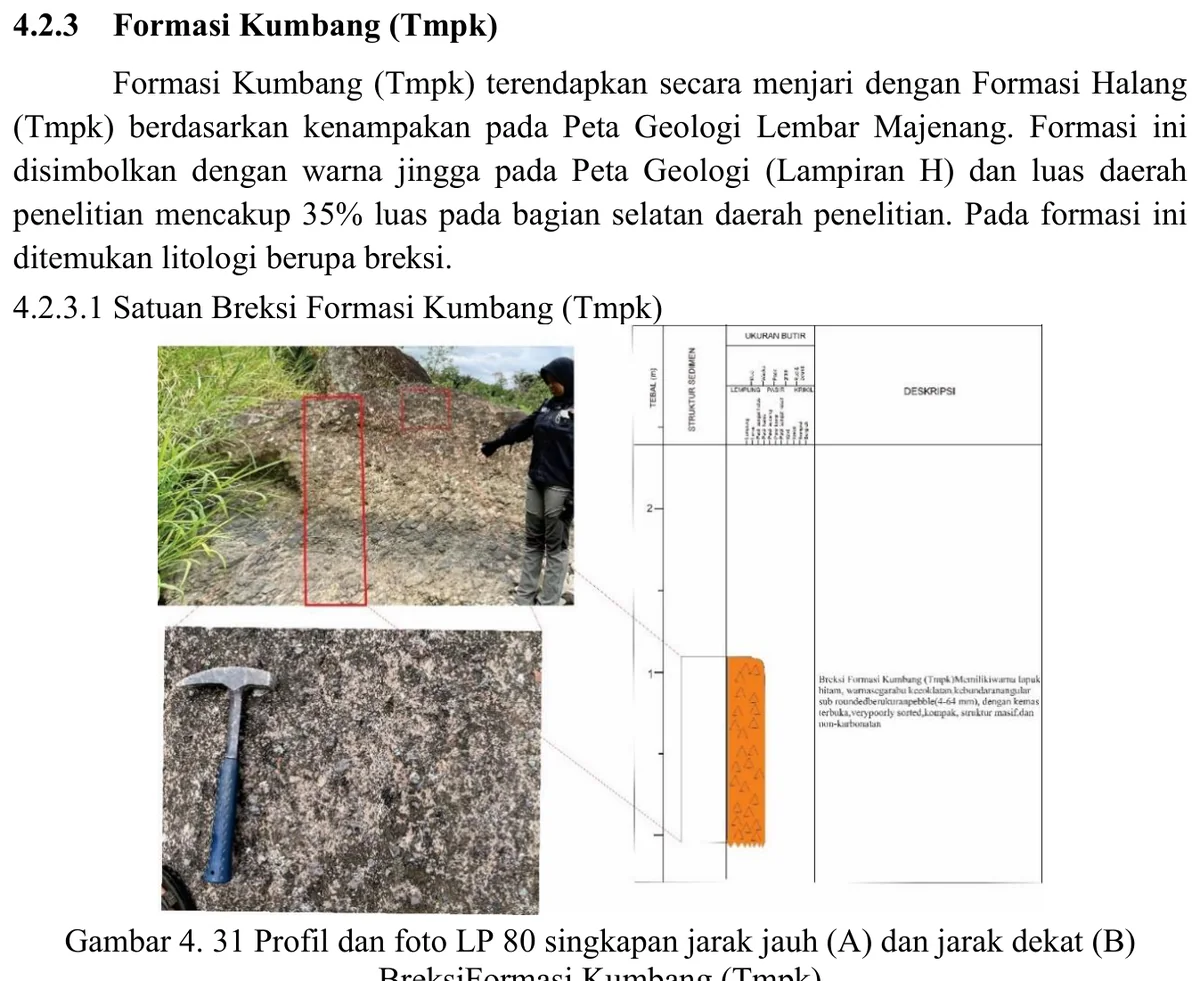
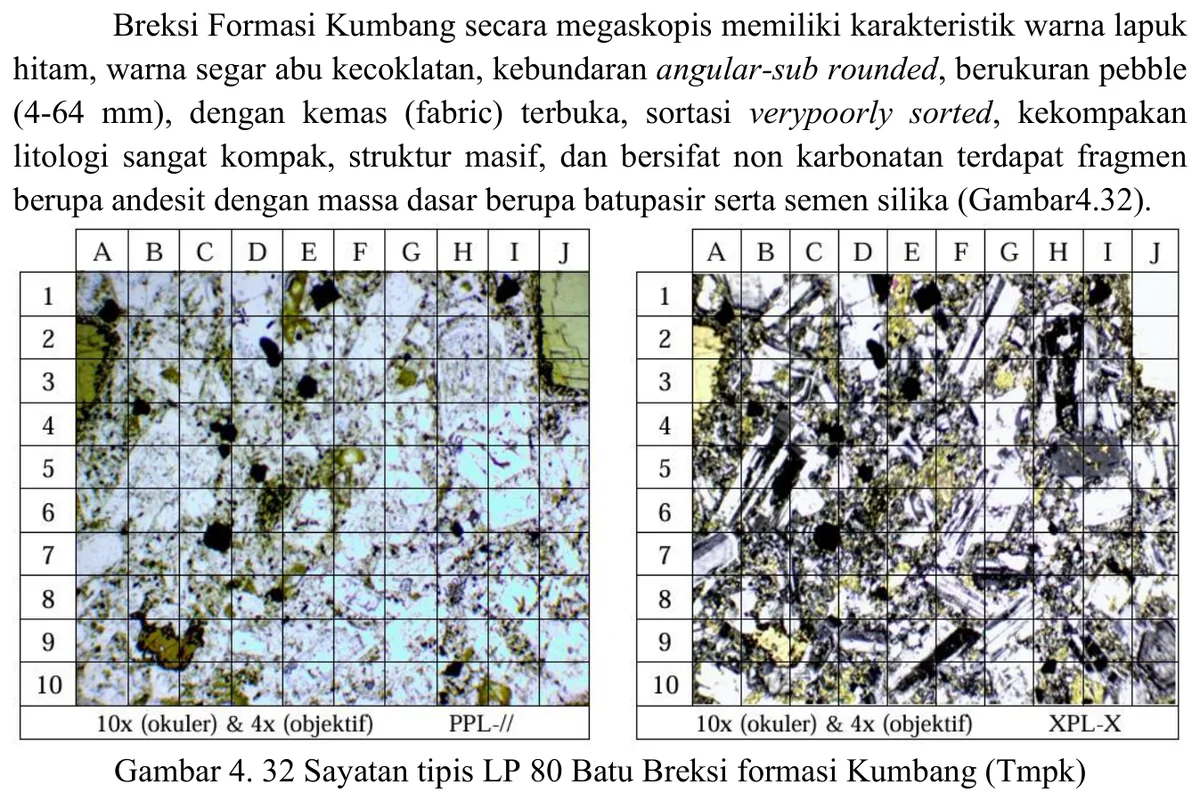
The analysed LP80 clast plots in the andesite field after QAP normalisation and shows a porphyritic, plagioclase-rich volcanic texture, supporting an intermediate volcanic source for that clast. It cannot classify the entire coarse body because a breccia may be polymictic and matrix composition may differ from clasts.
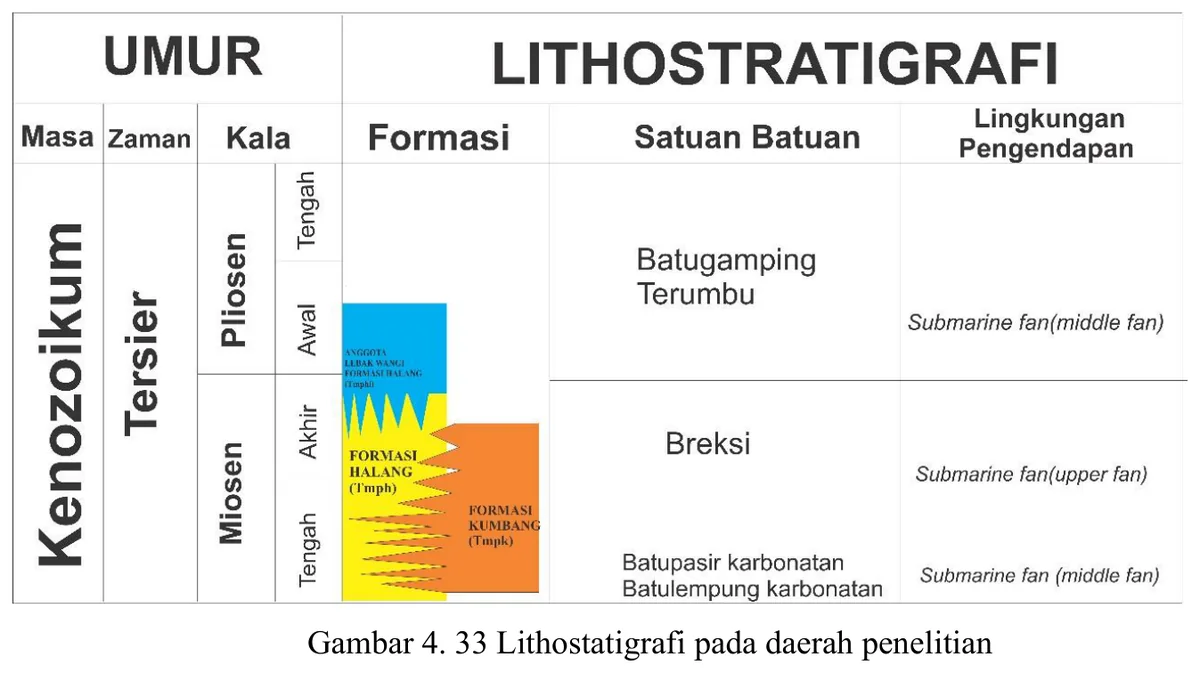
The lithostratigraphic framework is a synthesis of mapped units, fossil ages and inferred relationships, so it should visually separate observed contacts, inferred contacts, age constraints and regional correlation.
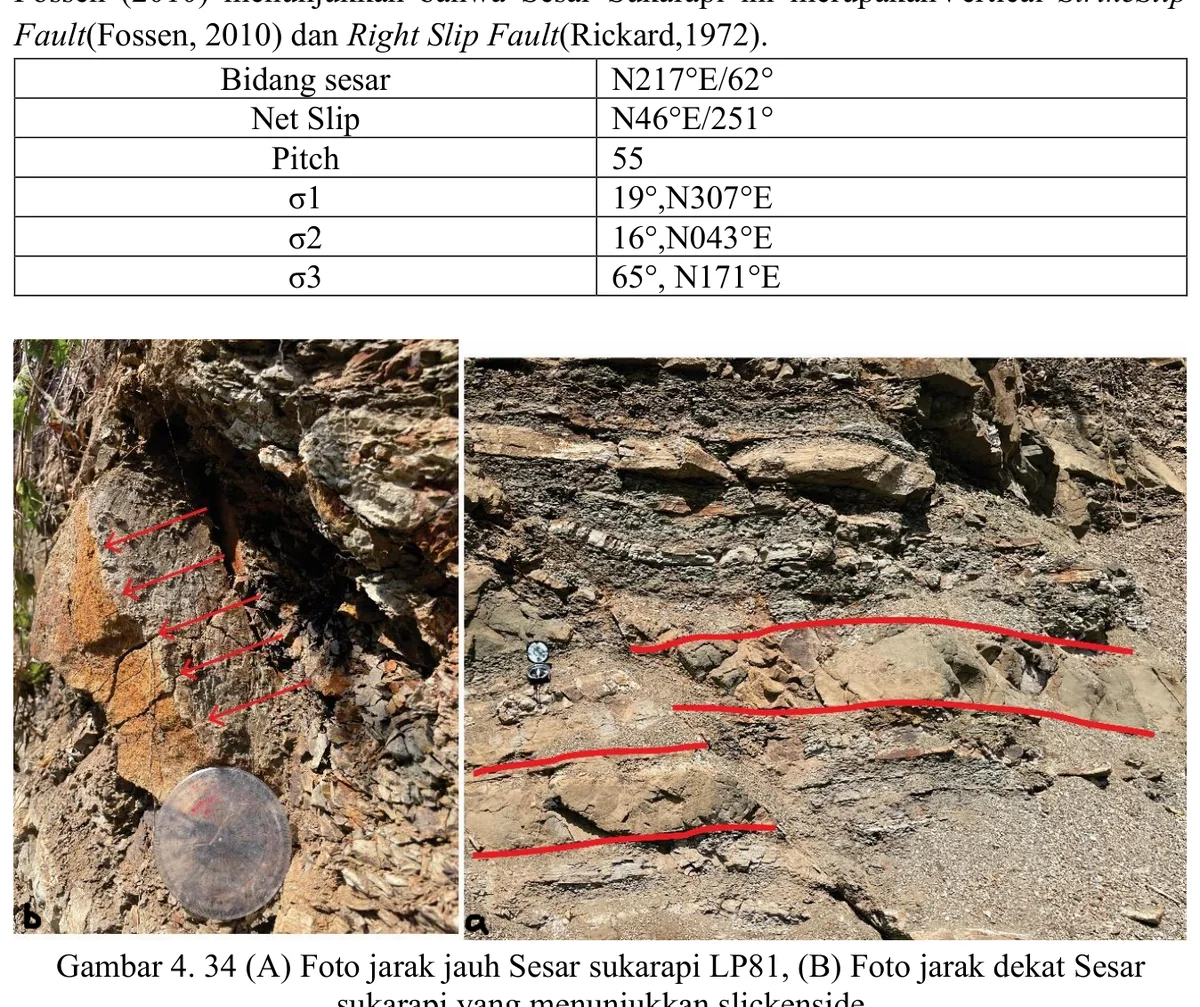
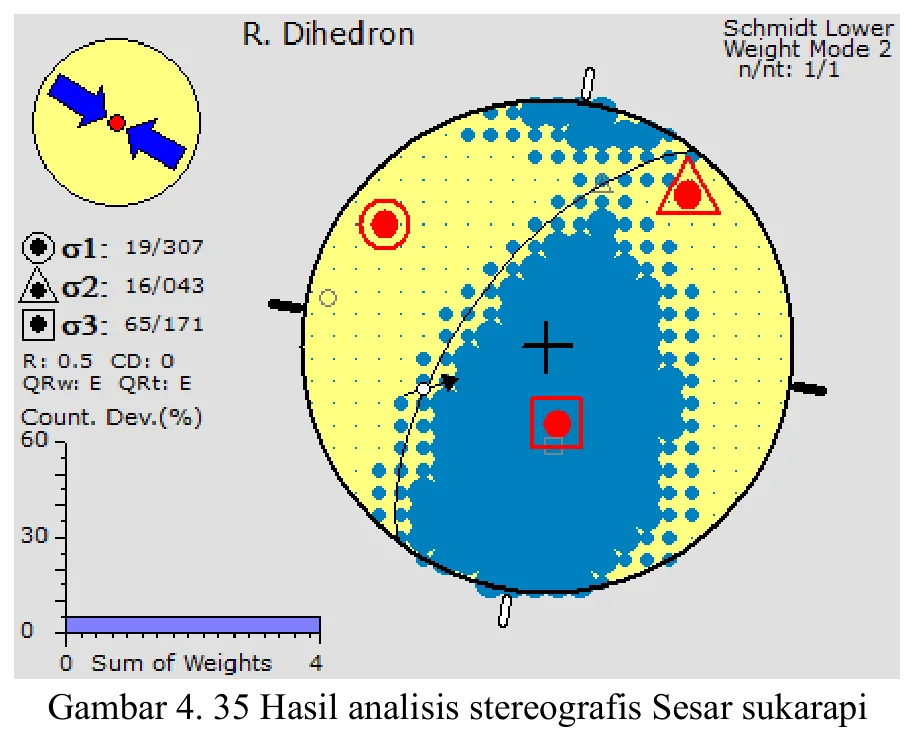
The stereographic solution translates the Sukarapi measurements into a three-dimensional kinematic hypothesis, but the input notation and projection conventions must be auditable. Plane strike/dip, slickenline rake or trend/plunge, lower- versus upper-hemisphere projection and assumed movement sense should be listed explicitly.
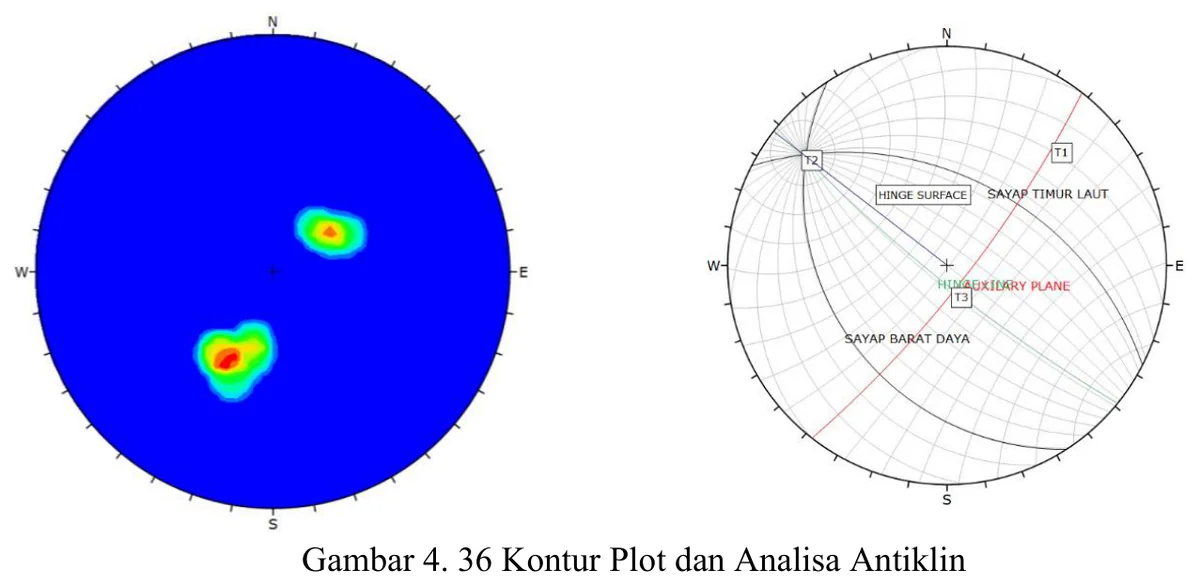
The anticline stereonet can estimate a fold axis from bedding poles only when the dataset samples both limbs adequately and poles define a statistically meaningful girdle. The plate should report the number of attitudes, limb grouping, orientation convention, best-fit great circle, calculated axis and angular confidence or dispersion.
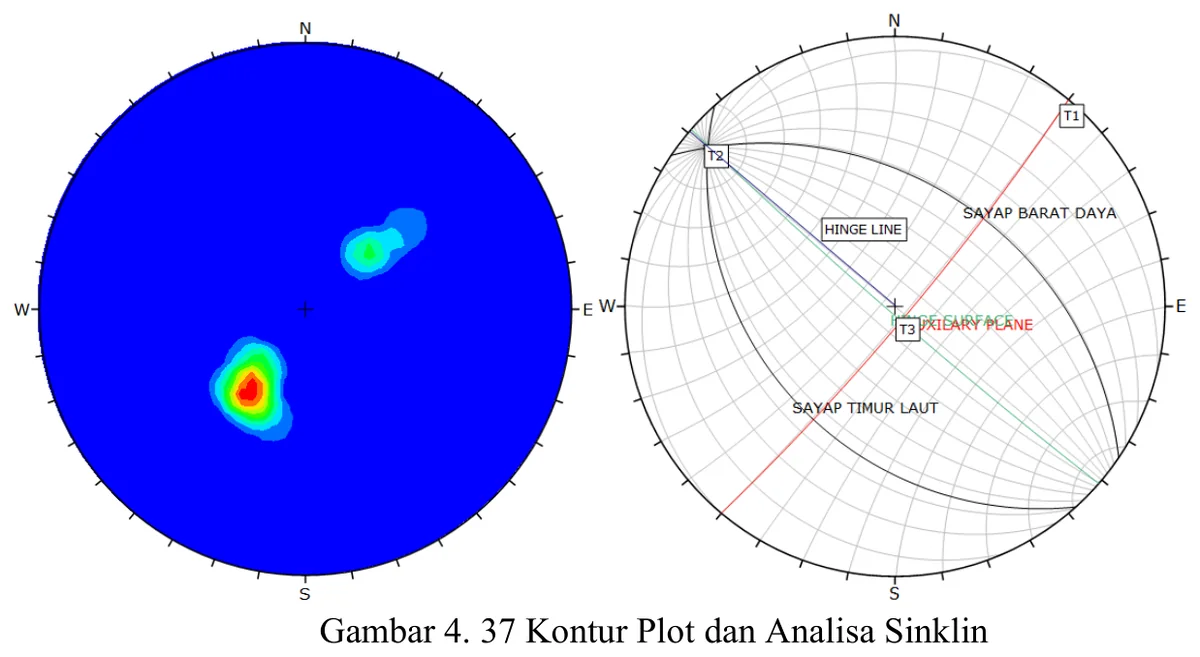
The syncline stereonet requires the same discipline as the anticline analysis: balanced limb sampling, consistent right-hand-rule notation, a defensible girdle fit and an uncertainty measure for the calculated fold axis.
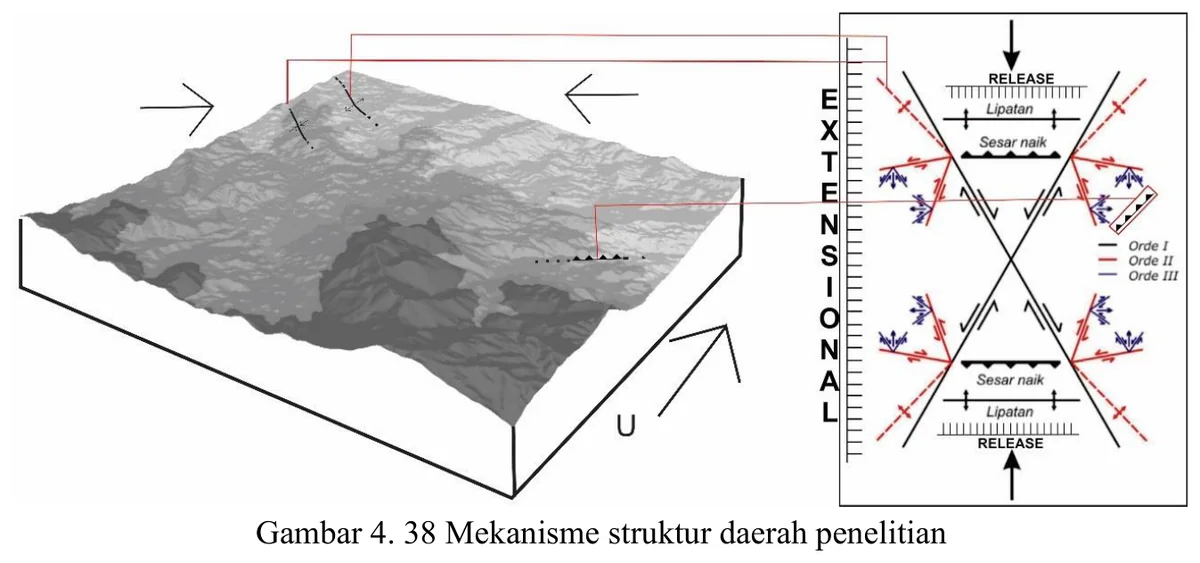
The conceptual structural mechanism explains how folding and faulting might coexist, but it is a causal model rather than a direct observation. Its usefulness depends on explicit predictions: expected fault orientation and slip, fold vergence, strain localisation, bed rotation and cross-cutting relationships.
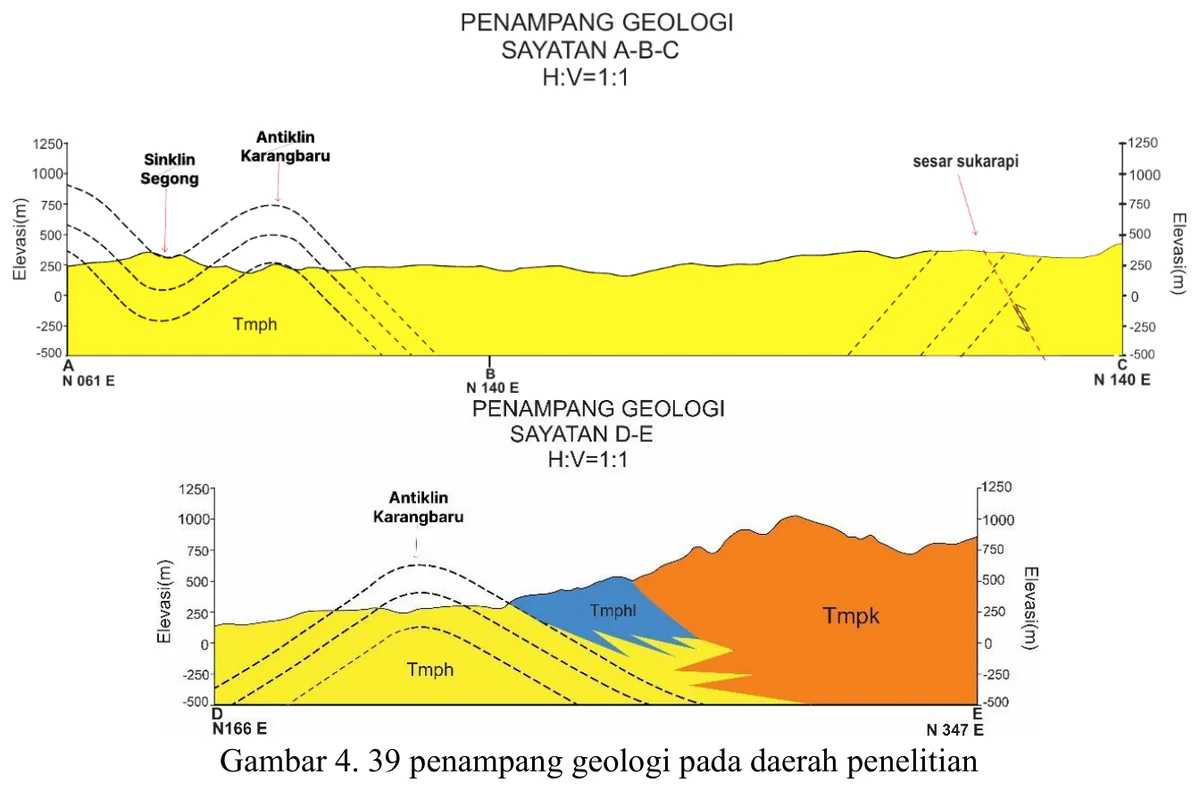
The geological cross-section is the project’s principal integration test because every contact, attitude, fold and fault must coexist geometrically beneath measured topography.