Observe
Read the photograph, scale and source description before naming a process.
INTEGRATED SYNTHESIS
The candidate report maps three principal rock associations: sandstone–claystone interbeds of the Halang Formation, reef limestone assigned to the Lebakwangi Member of the Halang Formation, and coarse volcanic breccia assigned to the Kumbang Formation. Halang and Kumbang are treated in the source as partly interfingering deep-marine successions, whereas the Lebakwangi carbonate records a shallower carbonate system later modified by dissolution. Published work south of Kuningan gives the Halang a credible regional analogue in a longitudinal, mud-dominated turbidite system with channels, splays, overbank deposits, sheet sandstones and basin plain; it does not make every Karangkancana bed one of those elements. At LP22, repeated sandstone and claystone beds demonstrate episodic gravity-flow deposition more securely than they demonstrate a particular fan position. At LP51 and LP82, limestone, skeletal material, micrite, spar and secondary porosity support carbonate deposition and diagenesis, while an in-situ reef framework remains a textural question. At LP80, poor sorting, volcanic clasts and matrix support establish coarse volcaniclastic mass transport; the exact primary-versus-reworked origin remains open. The Sukarapi structure is anchored by a slickensided plane within Halang interbeds and the source measurements at LP81. Fold, fault and stratigraphic interpretations are accepted only where the photographs, attitudes, map pattern and cross-section tell the same story.
Read the photograph, scale and source description before naming a process.
Test one station against neighbouring stations, thin sections, fossils and map geometry.
Keep a competing explanation wherever the present data cannot choose.
State the field measurement or laboratory result that would change the model.
ROCK OUTCROP · FLAGSHIP DISPLAY
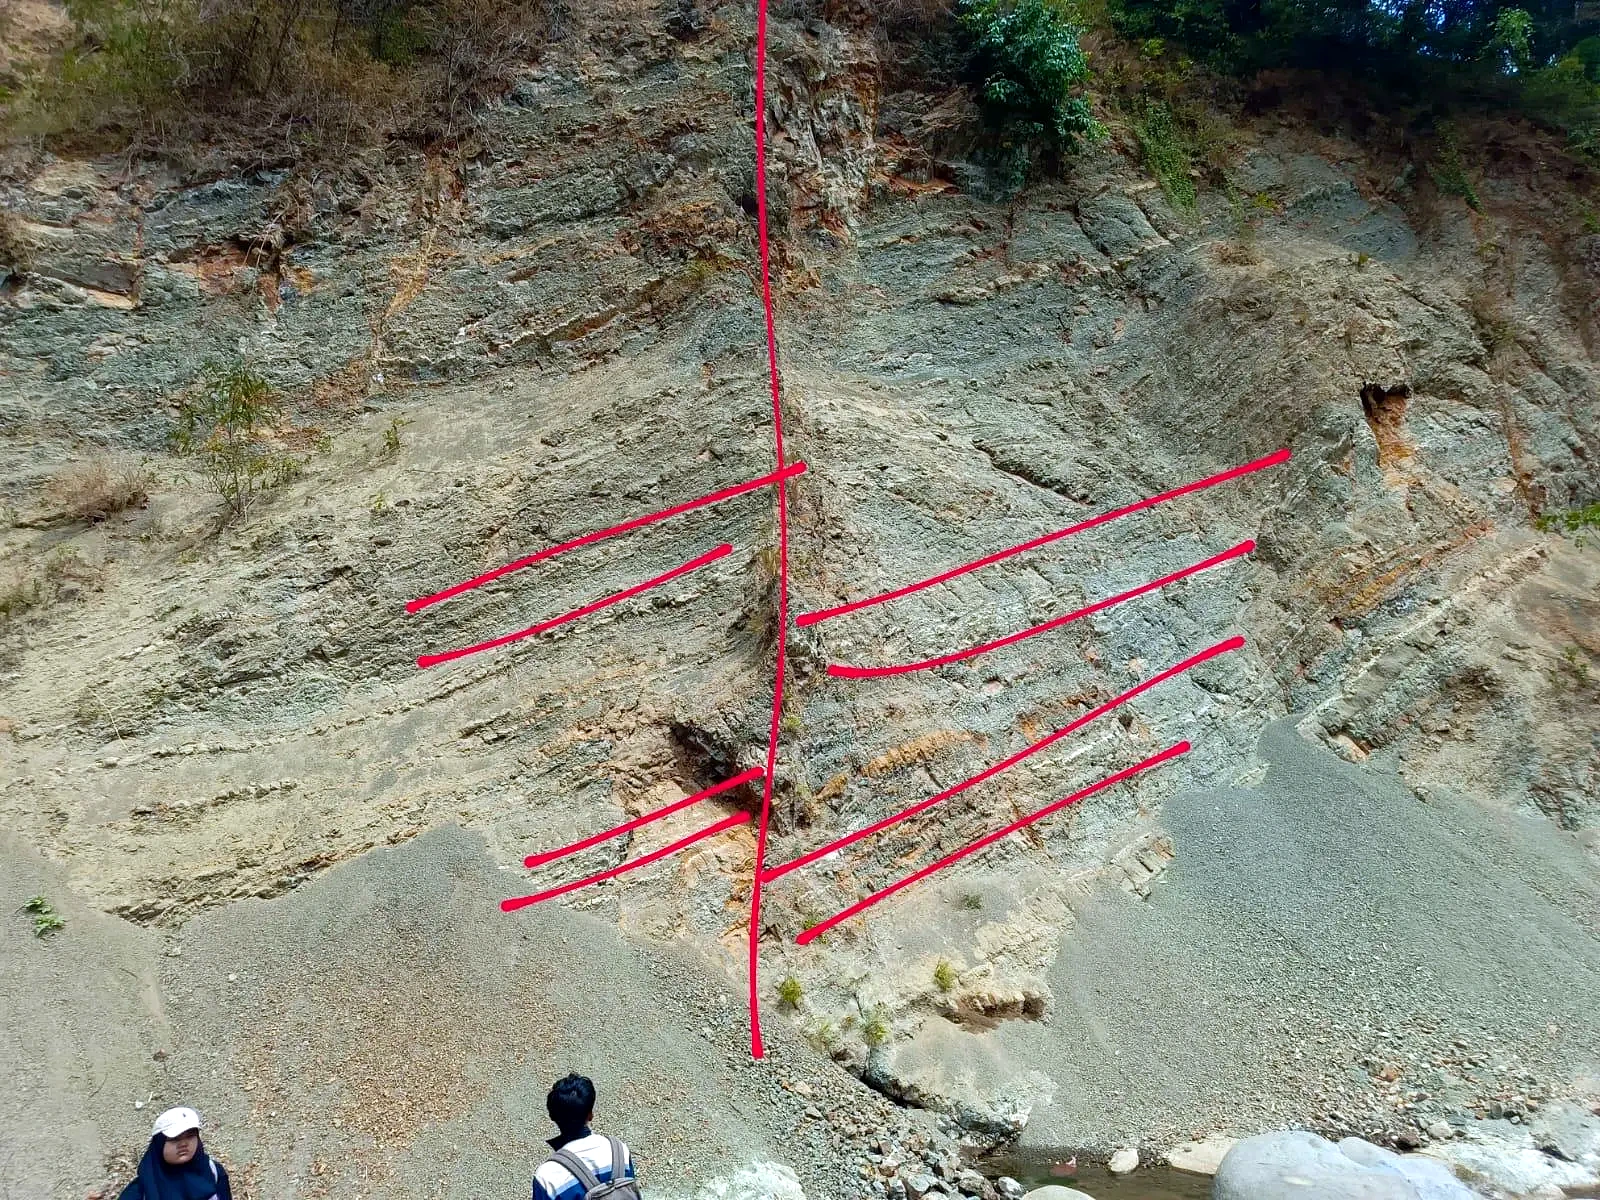
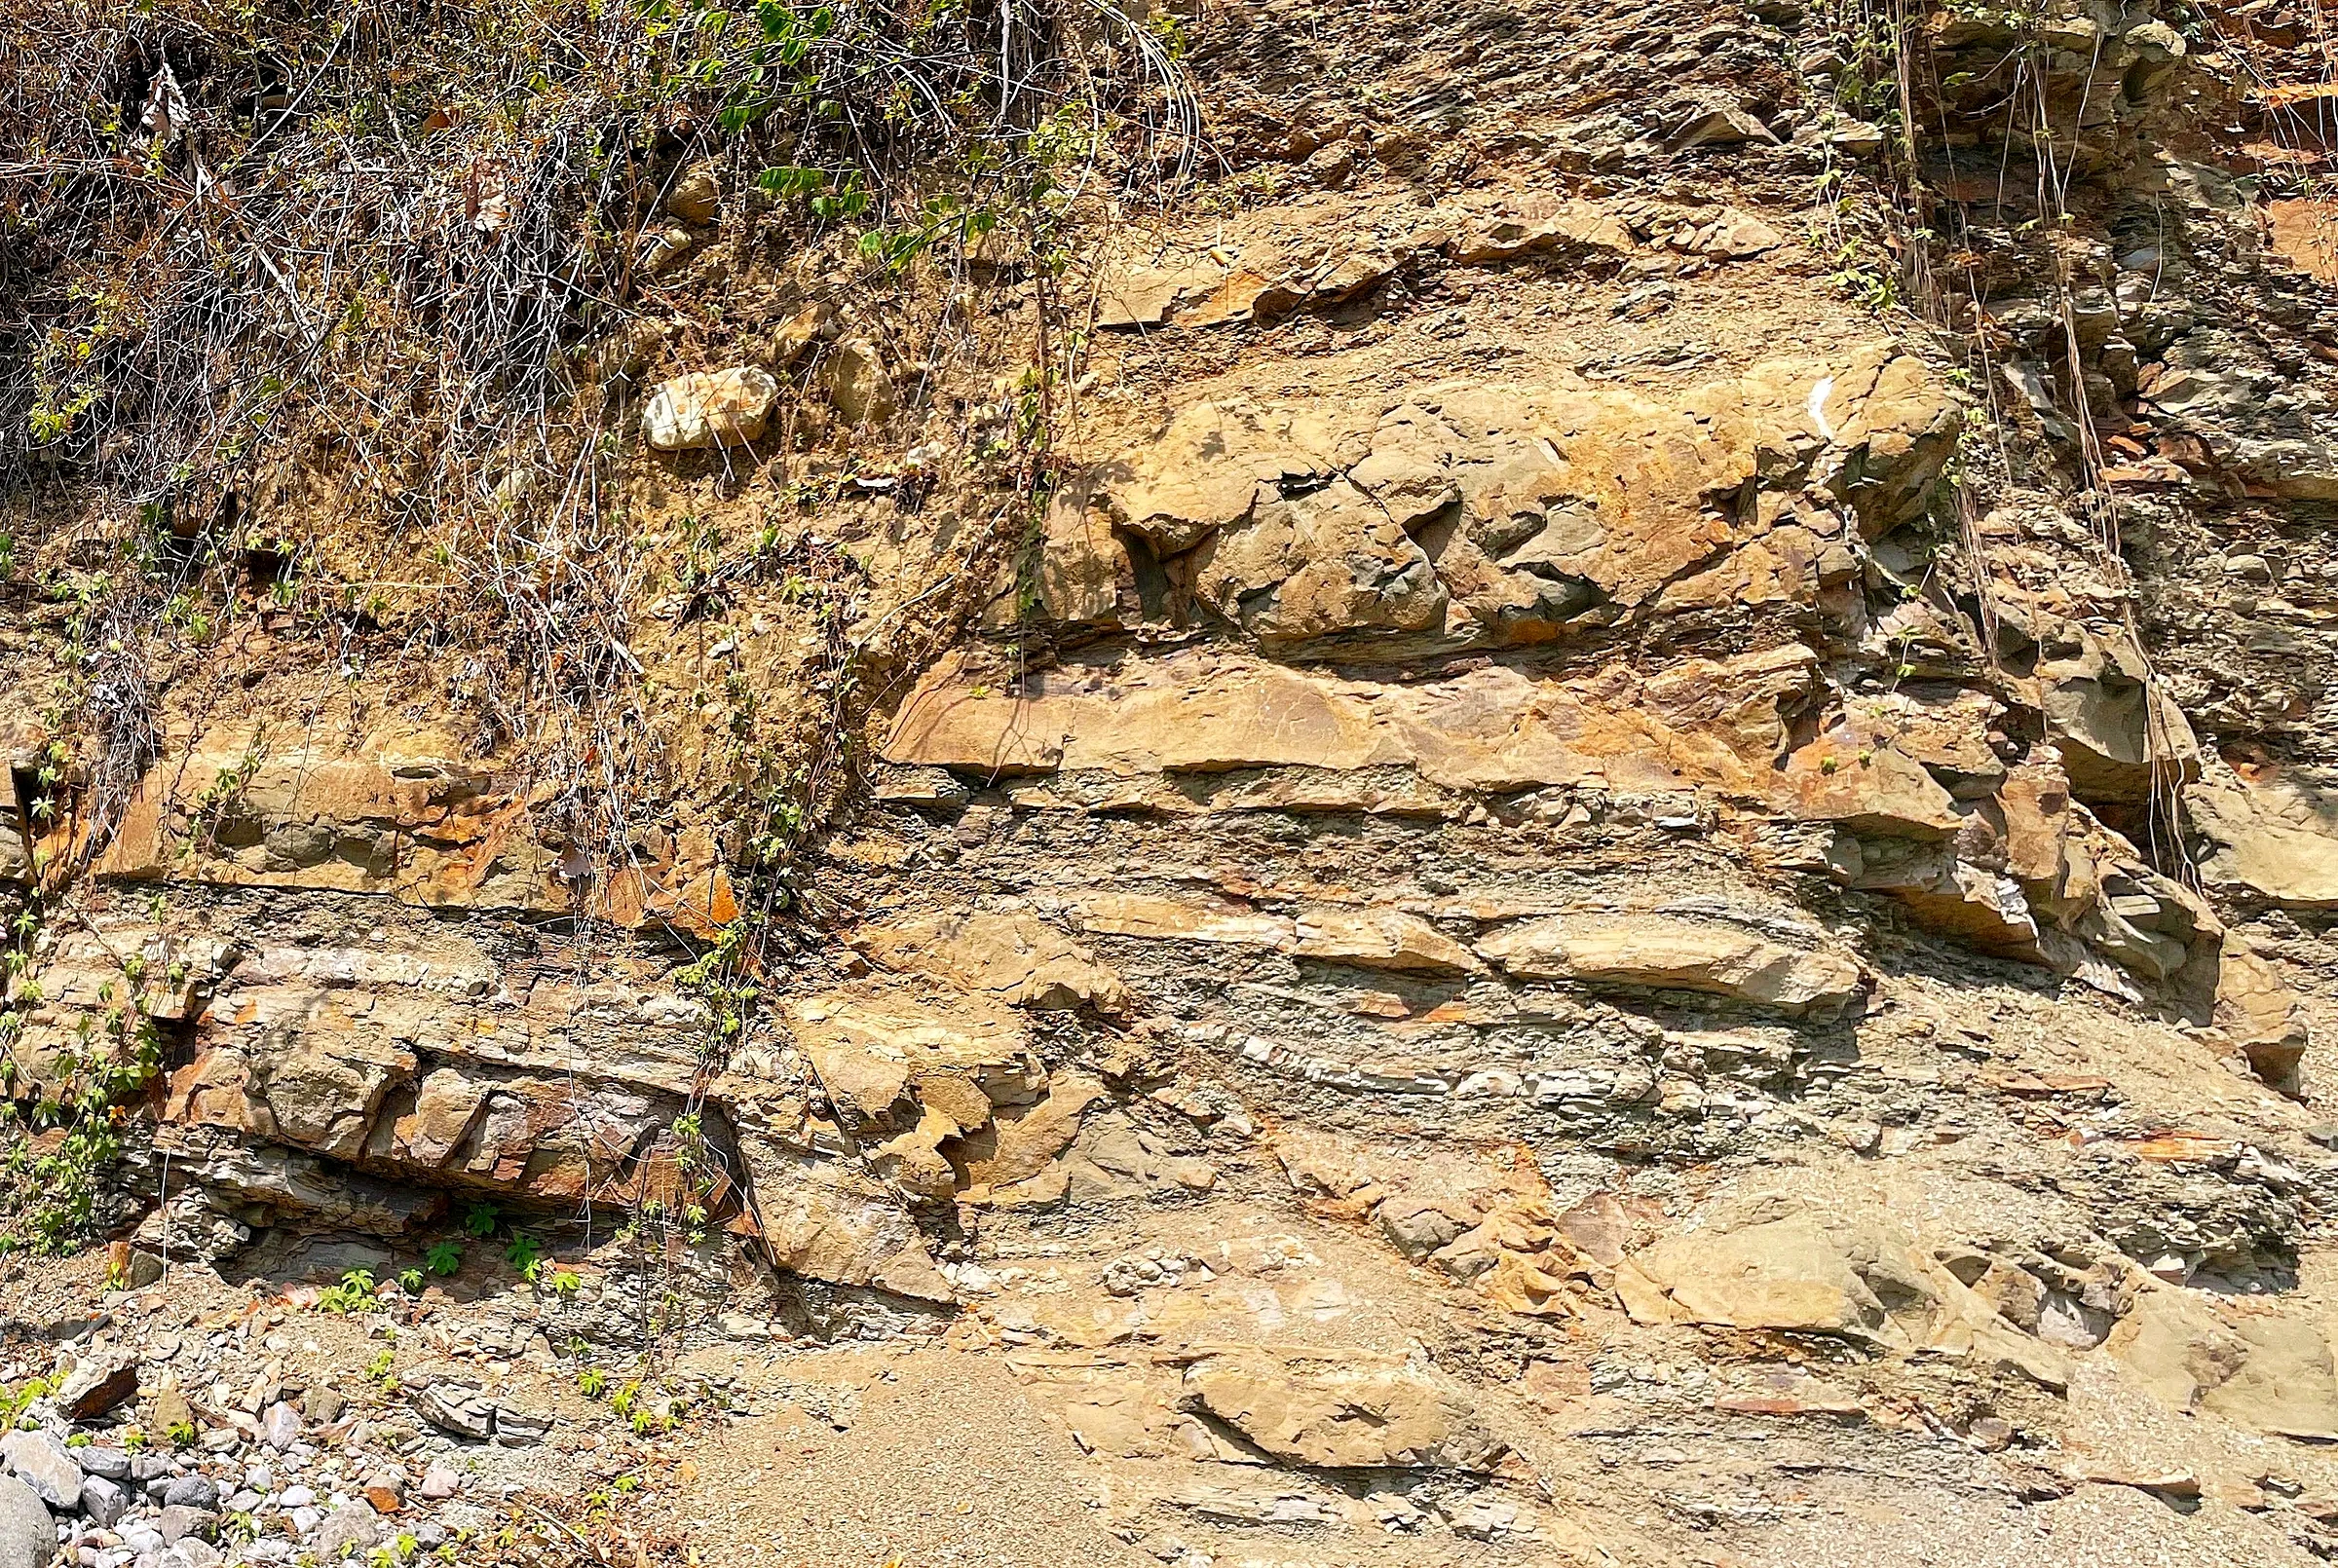
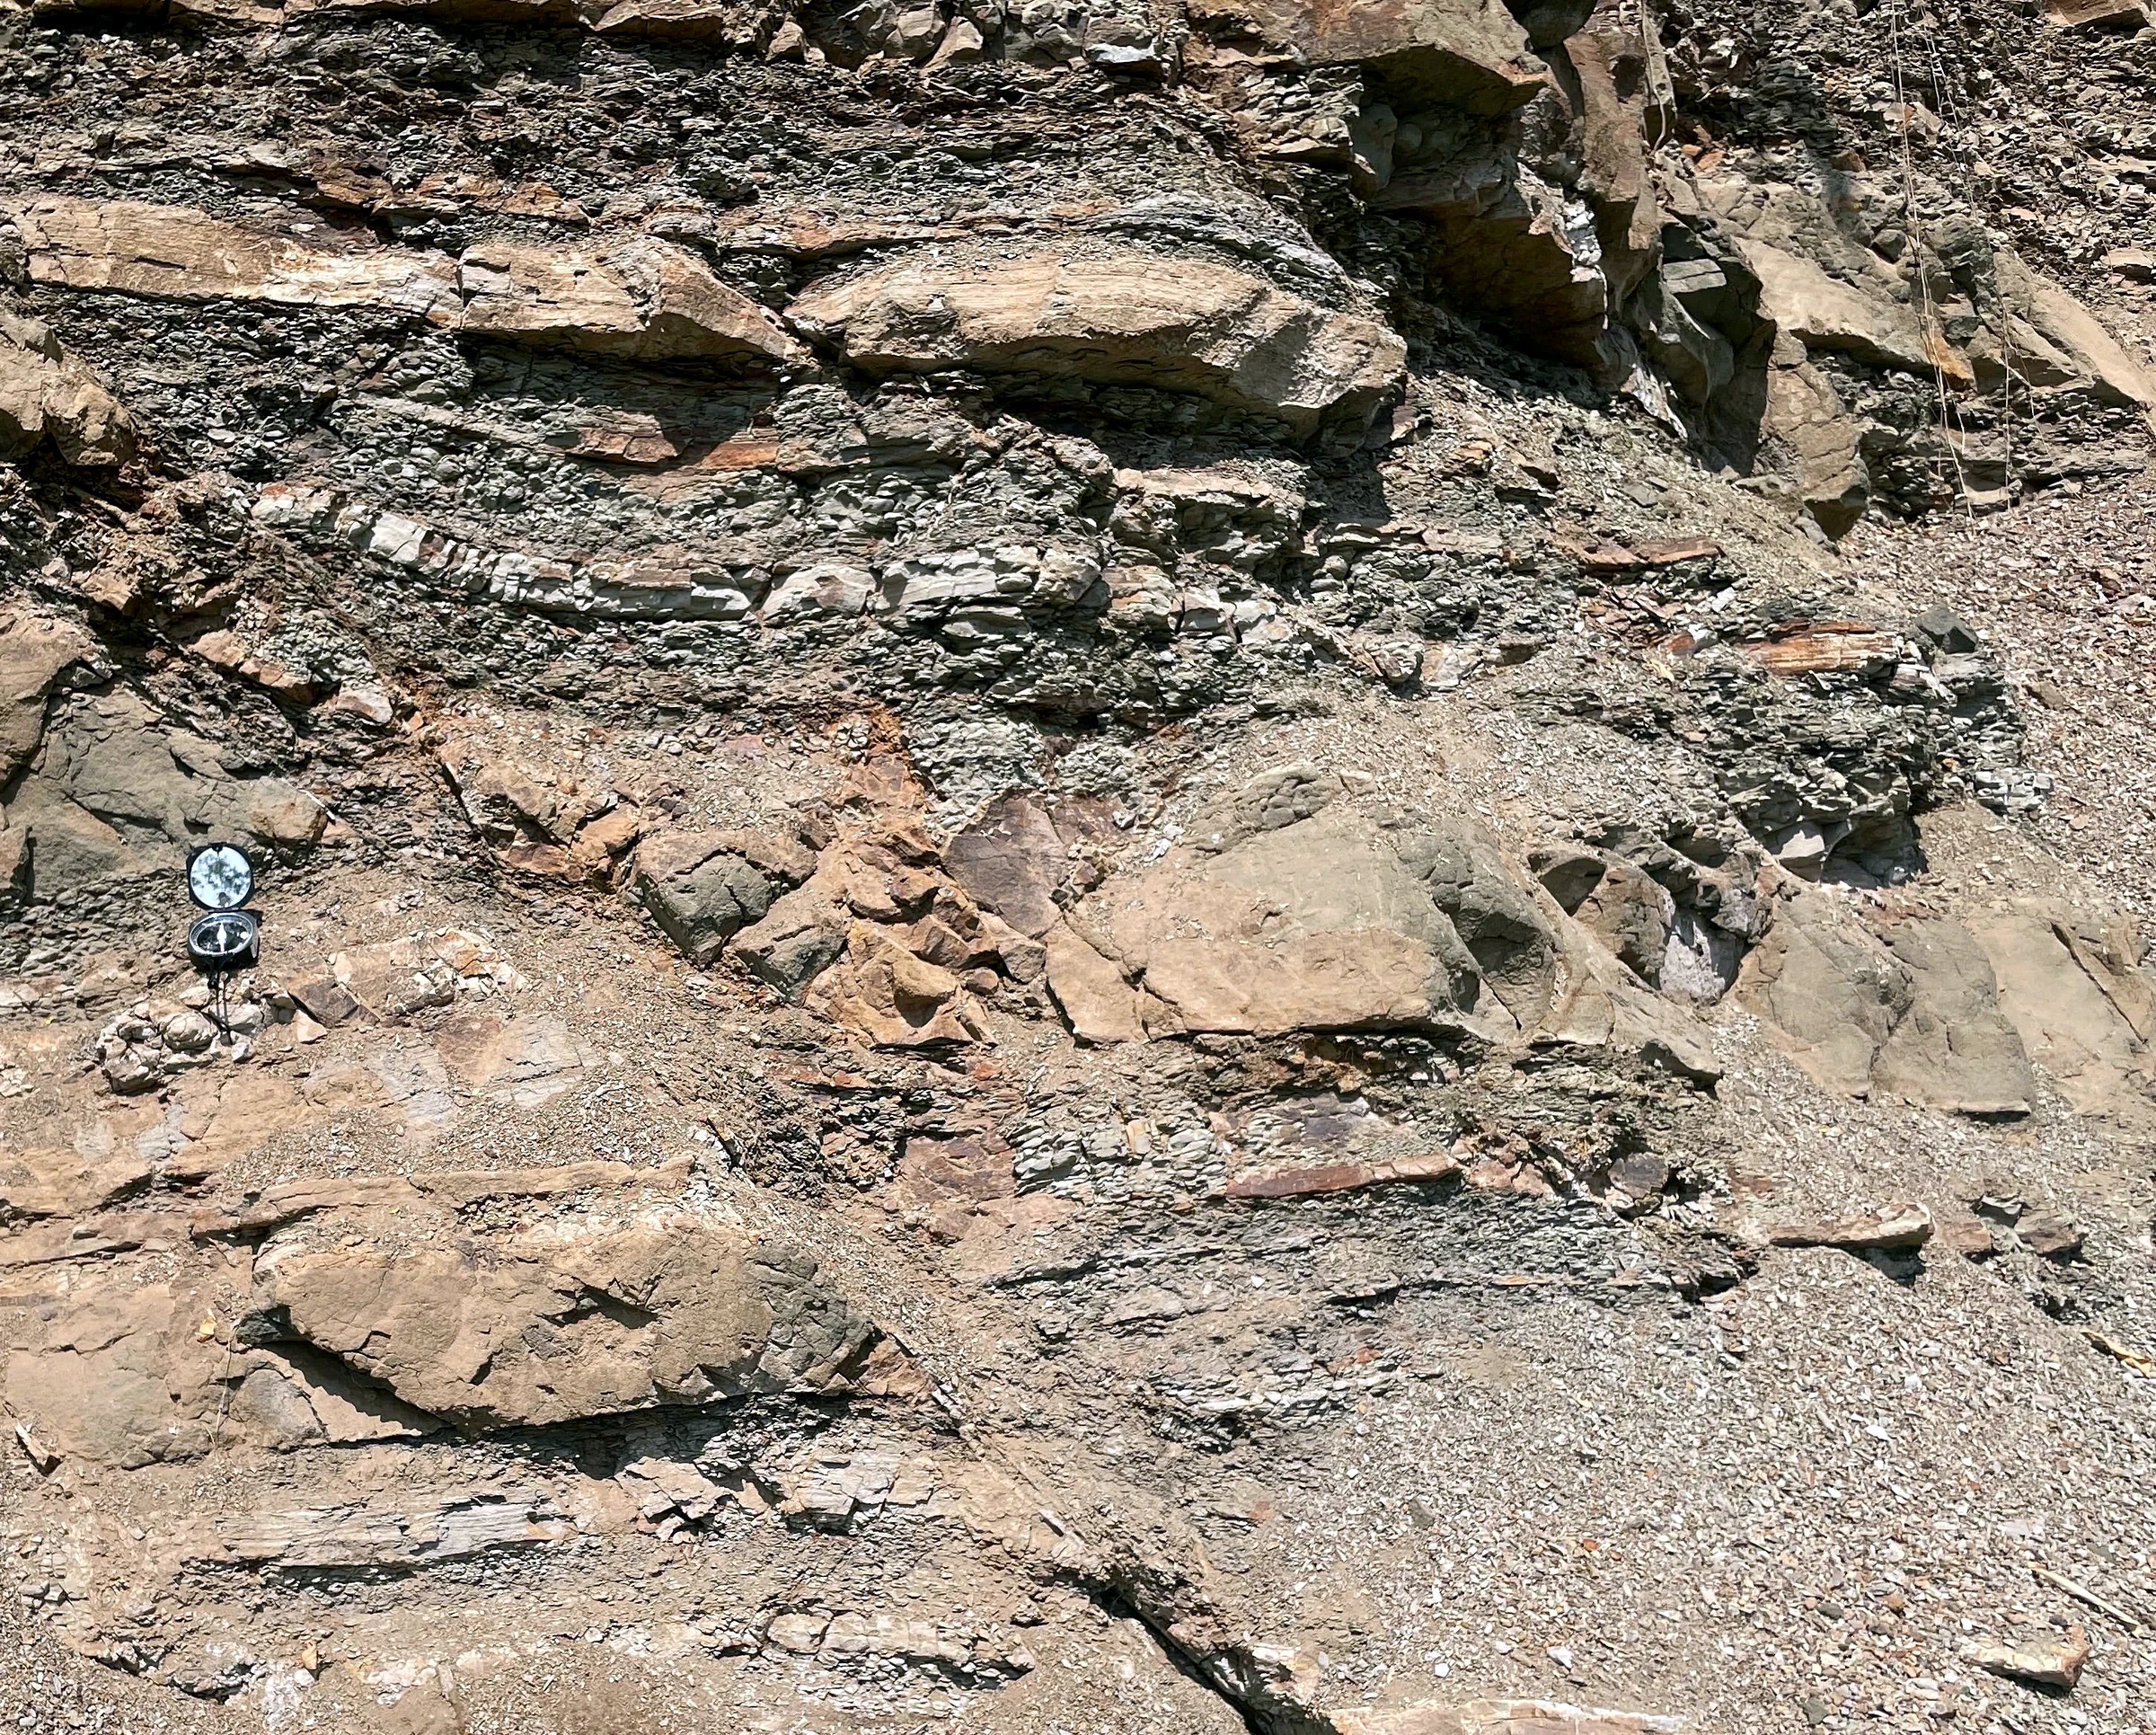
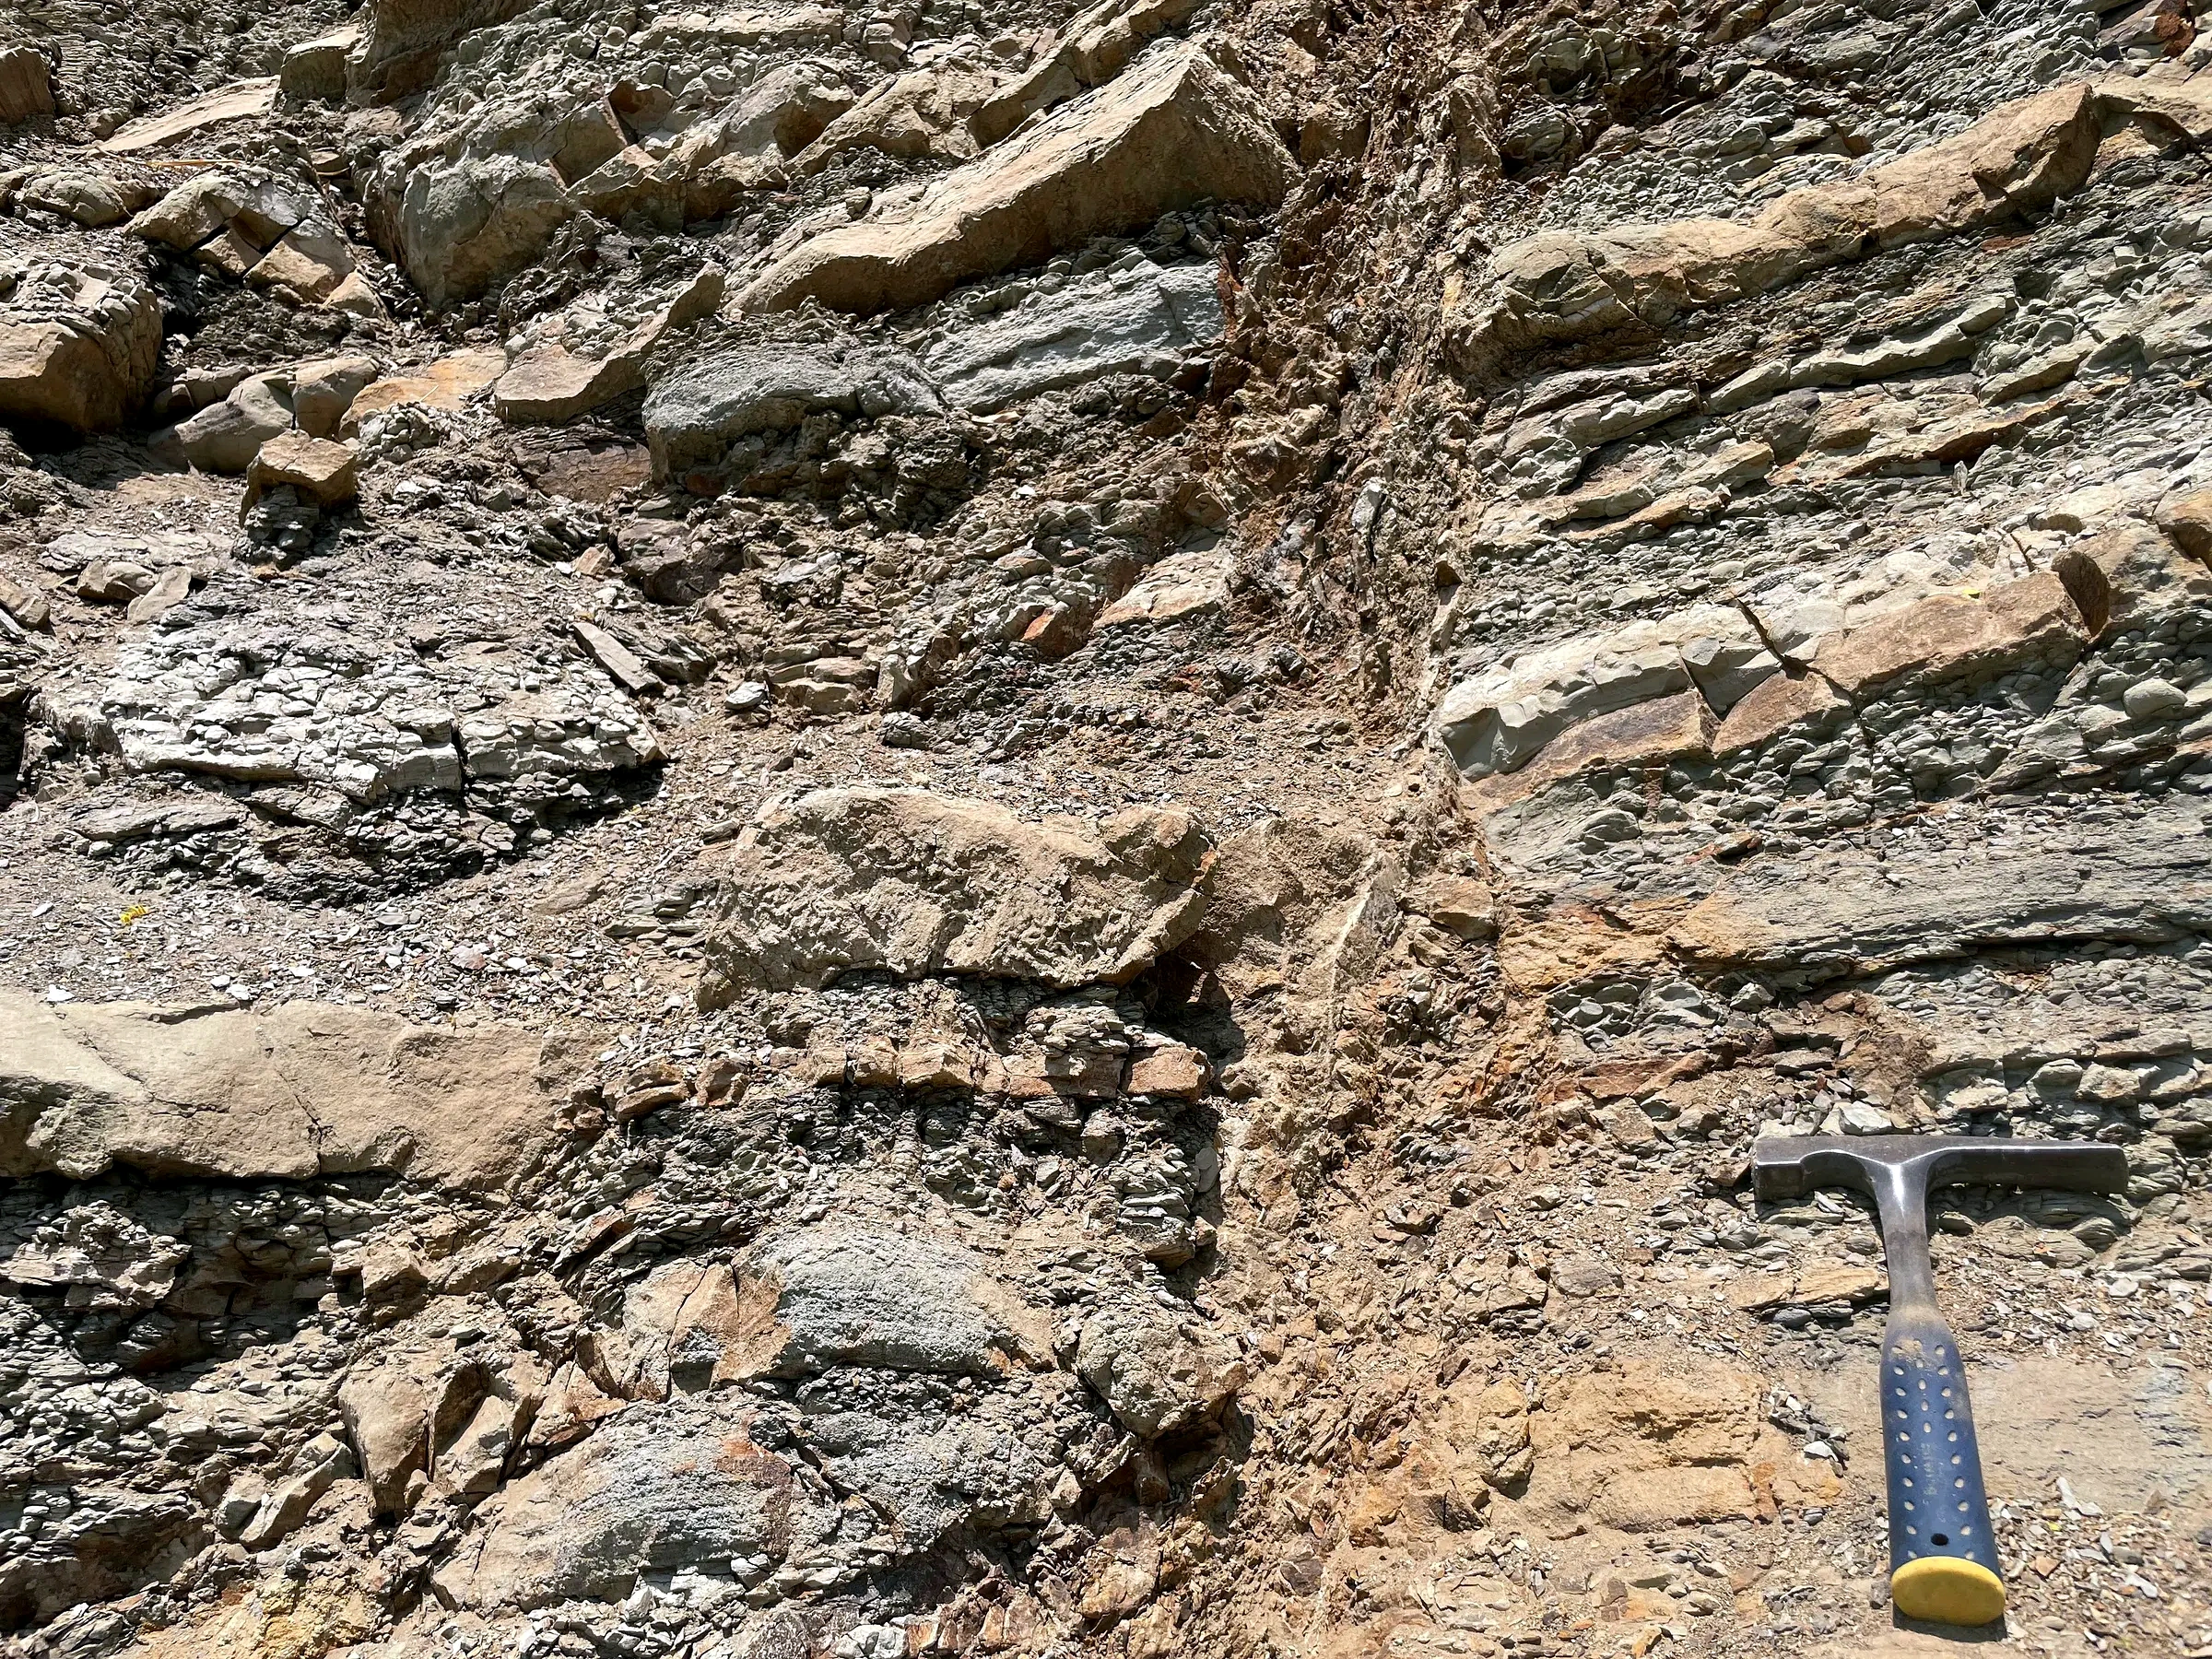
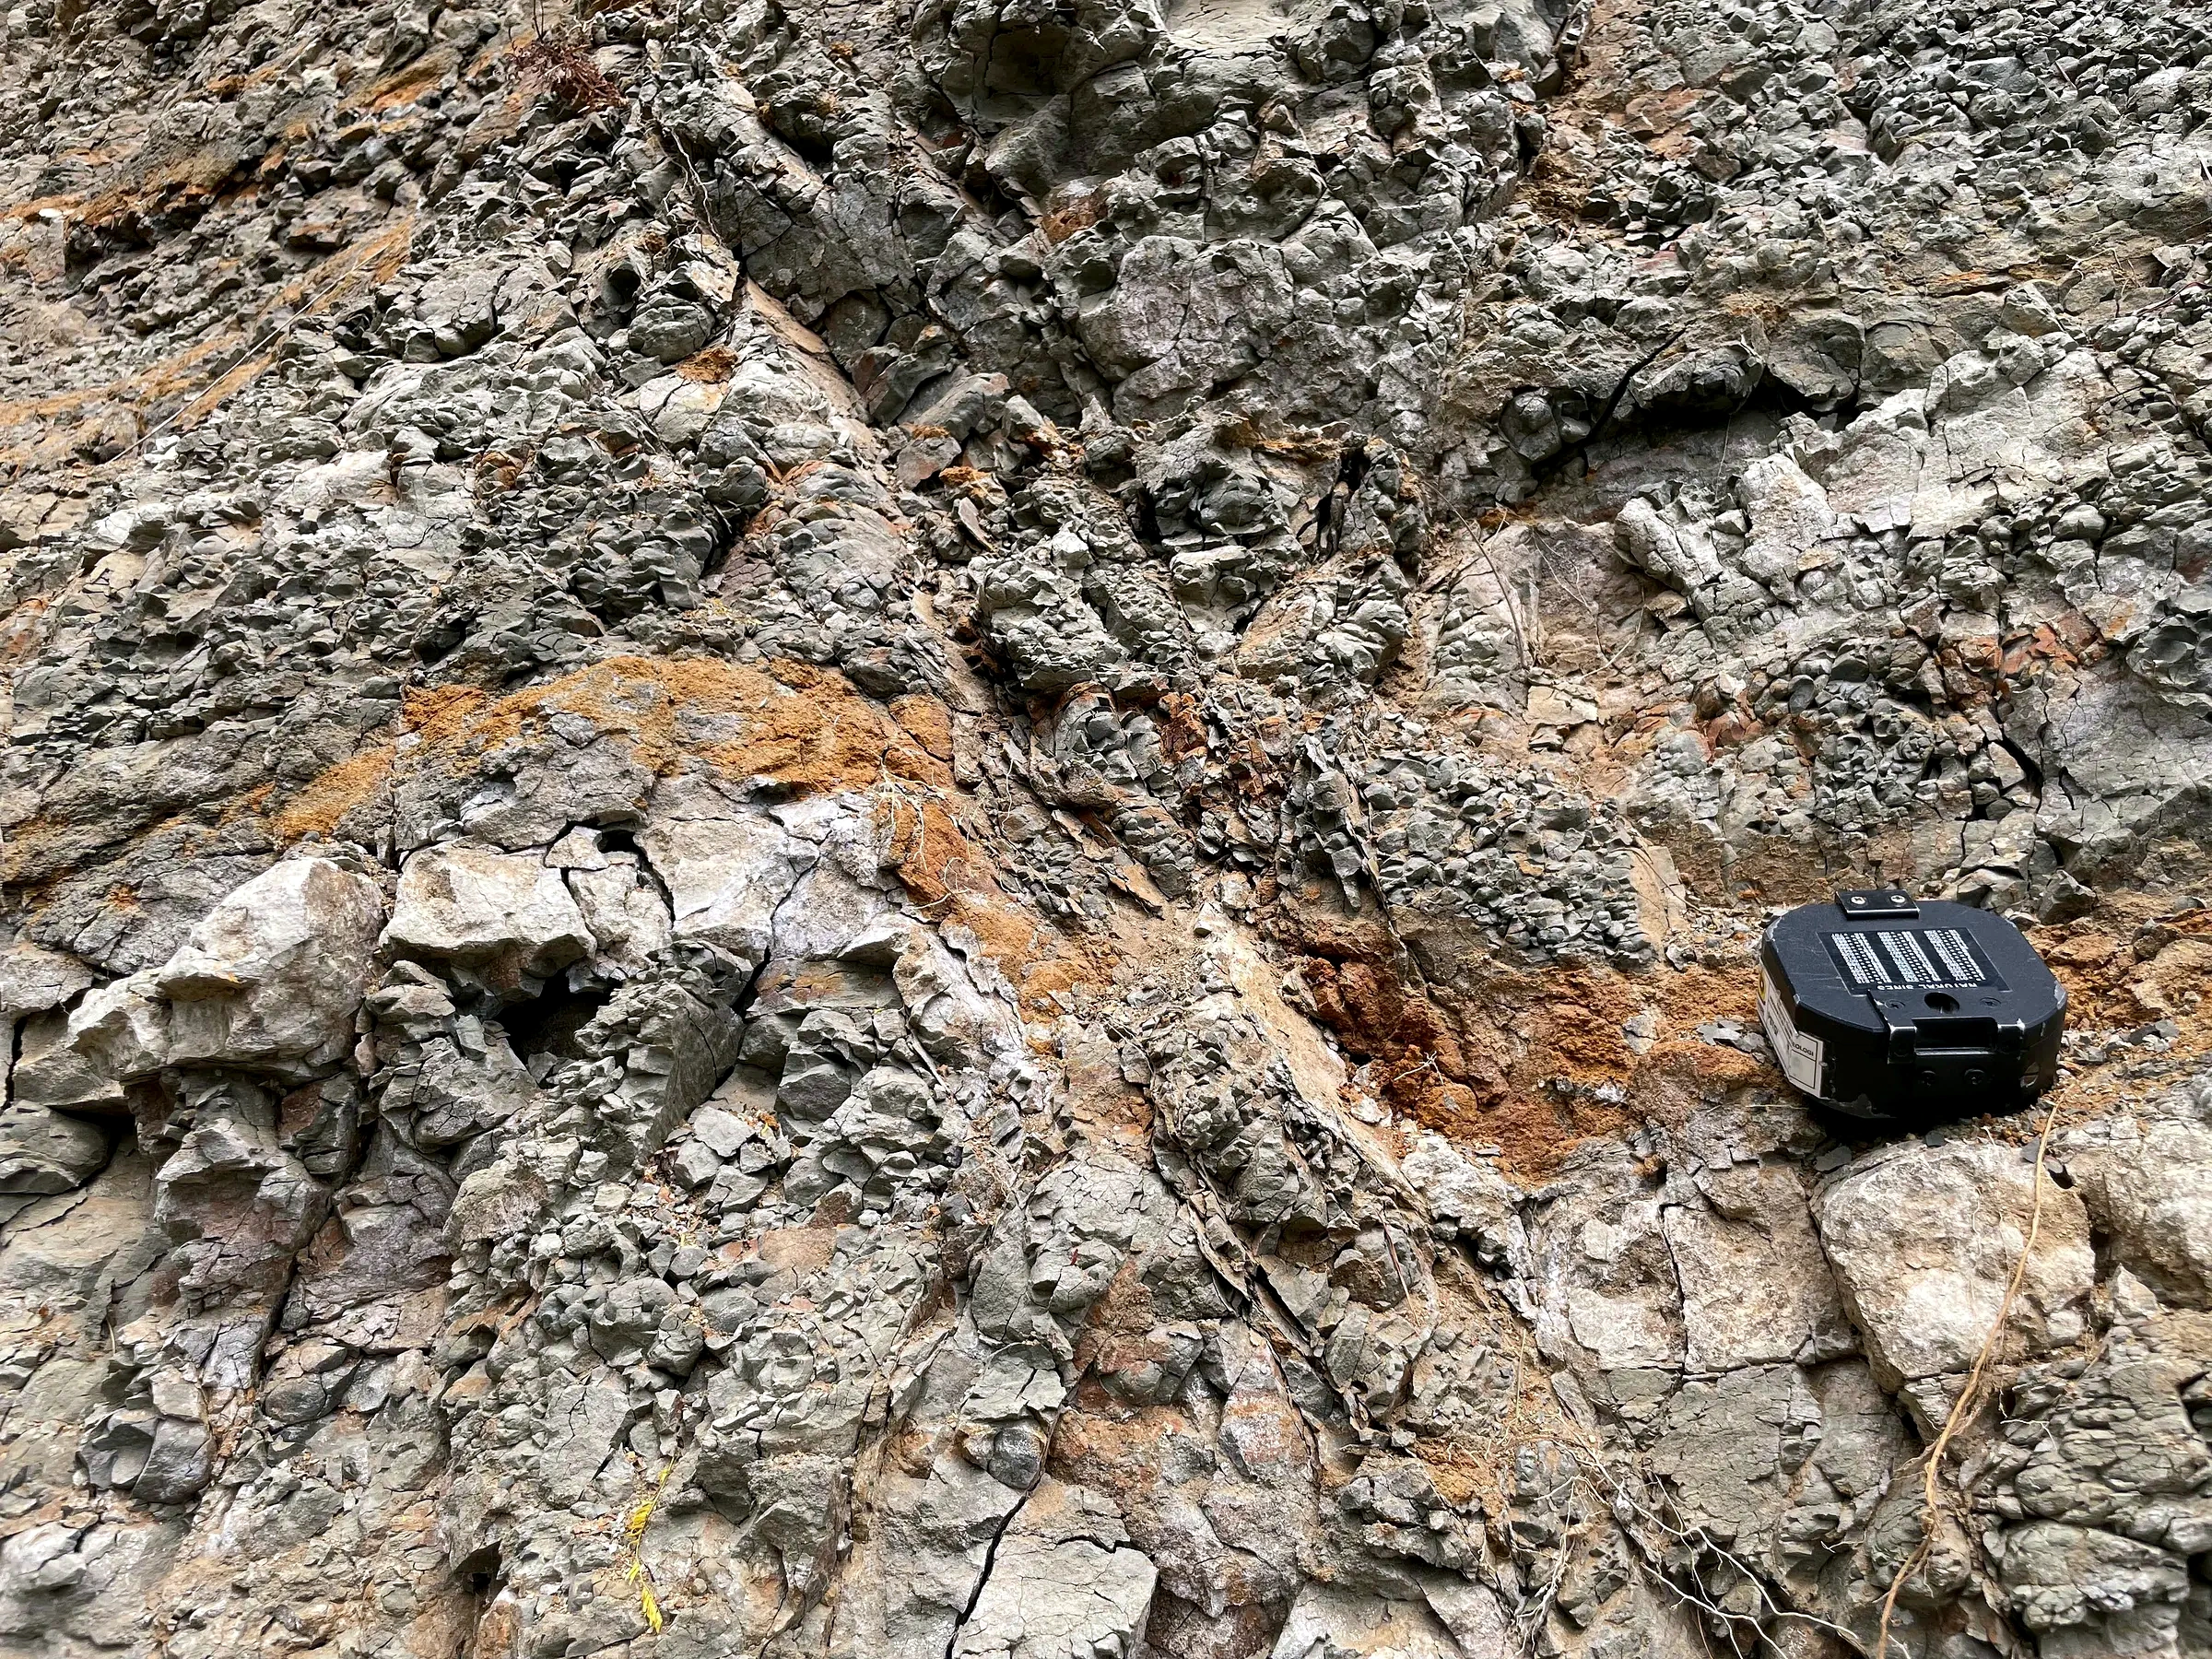
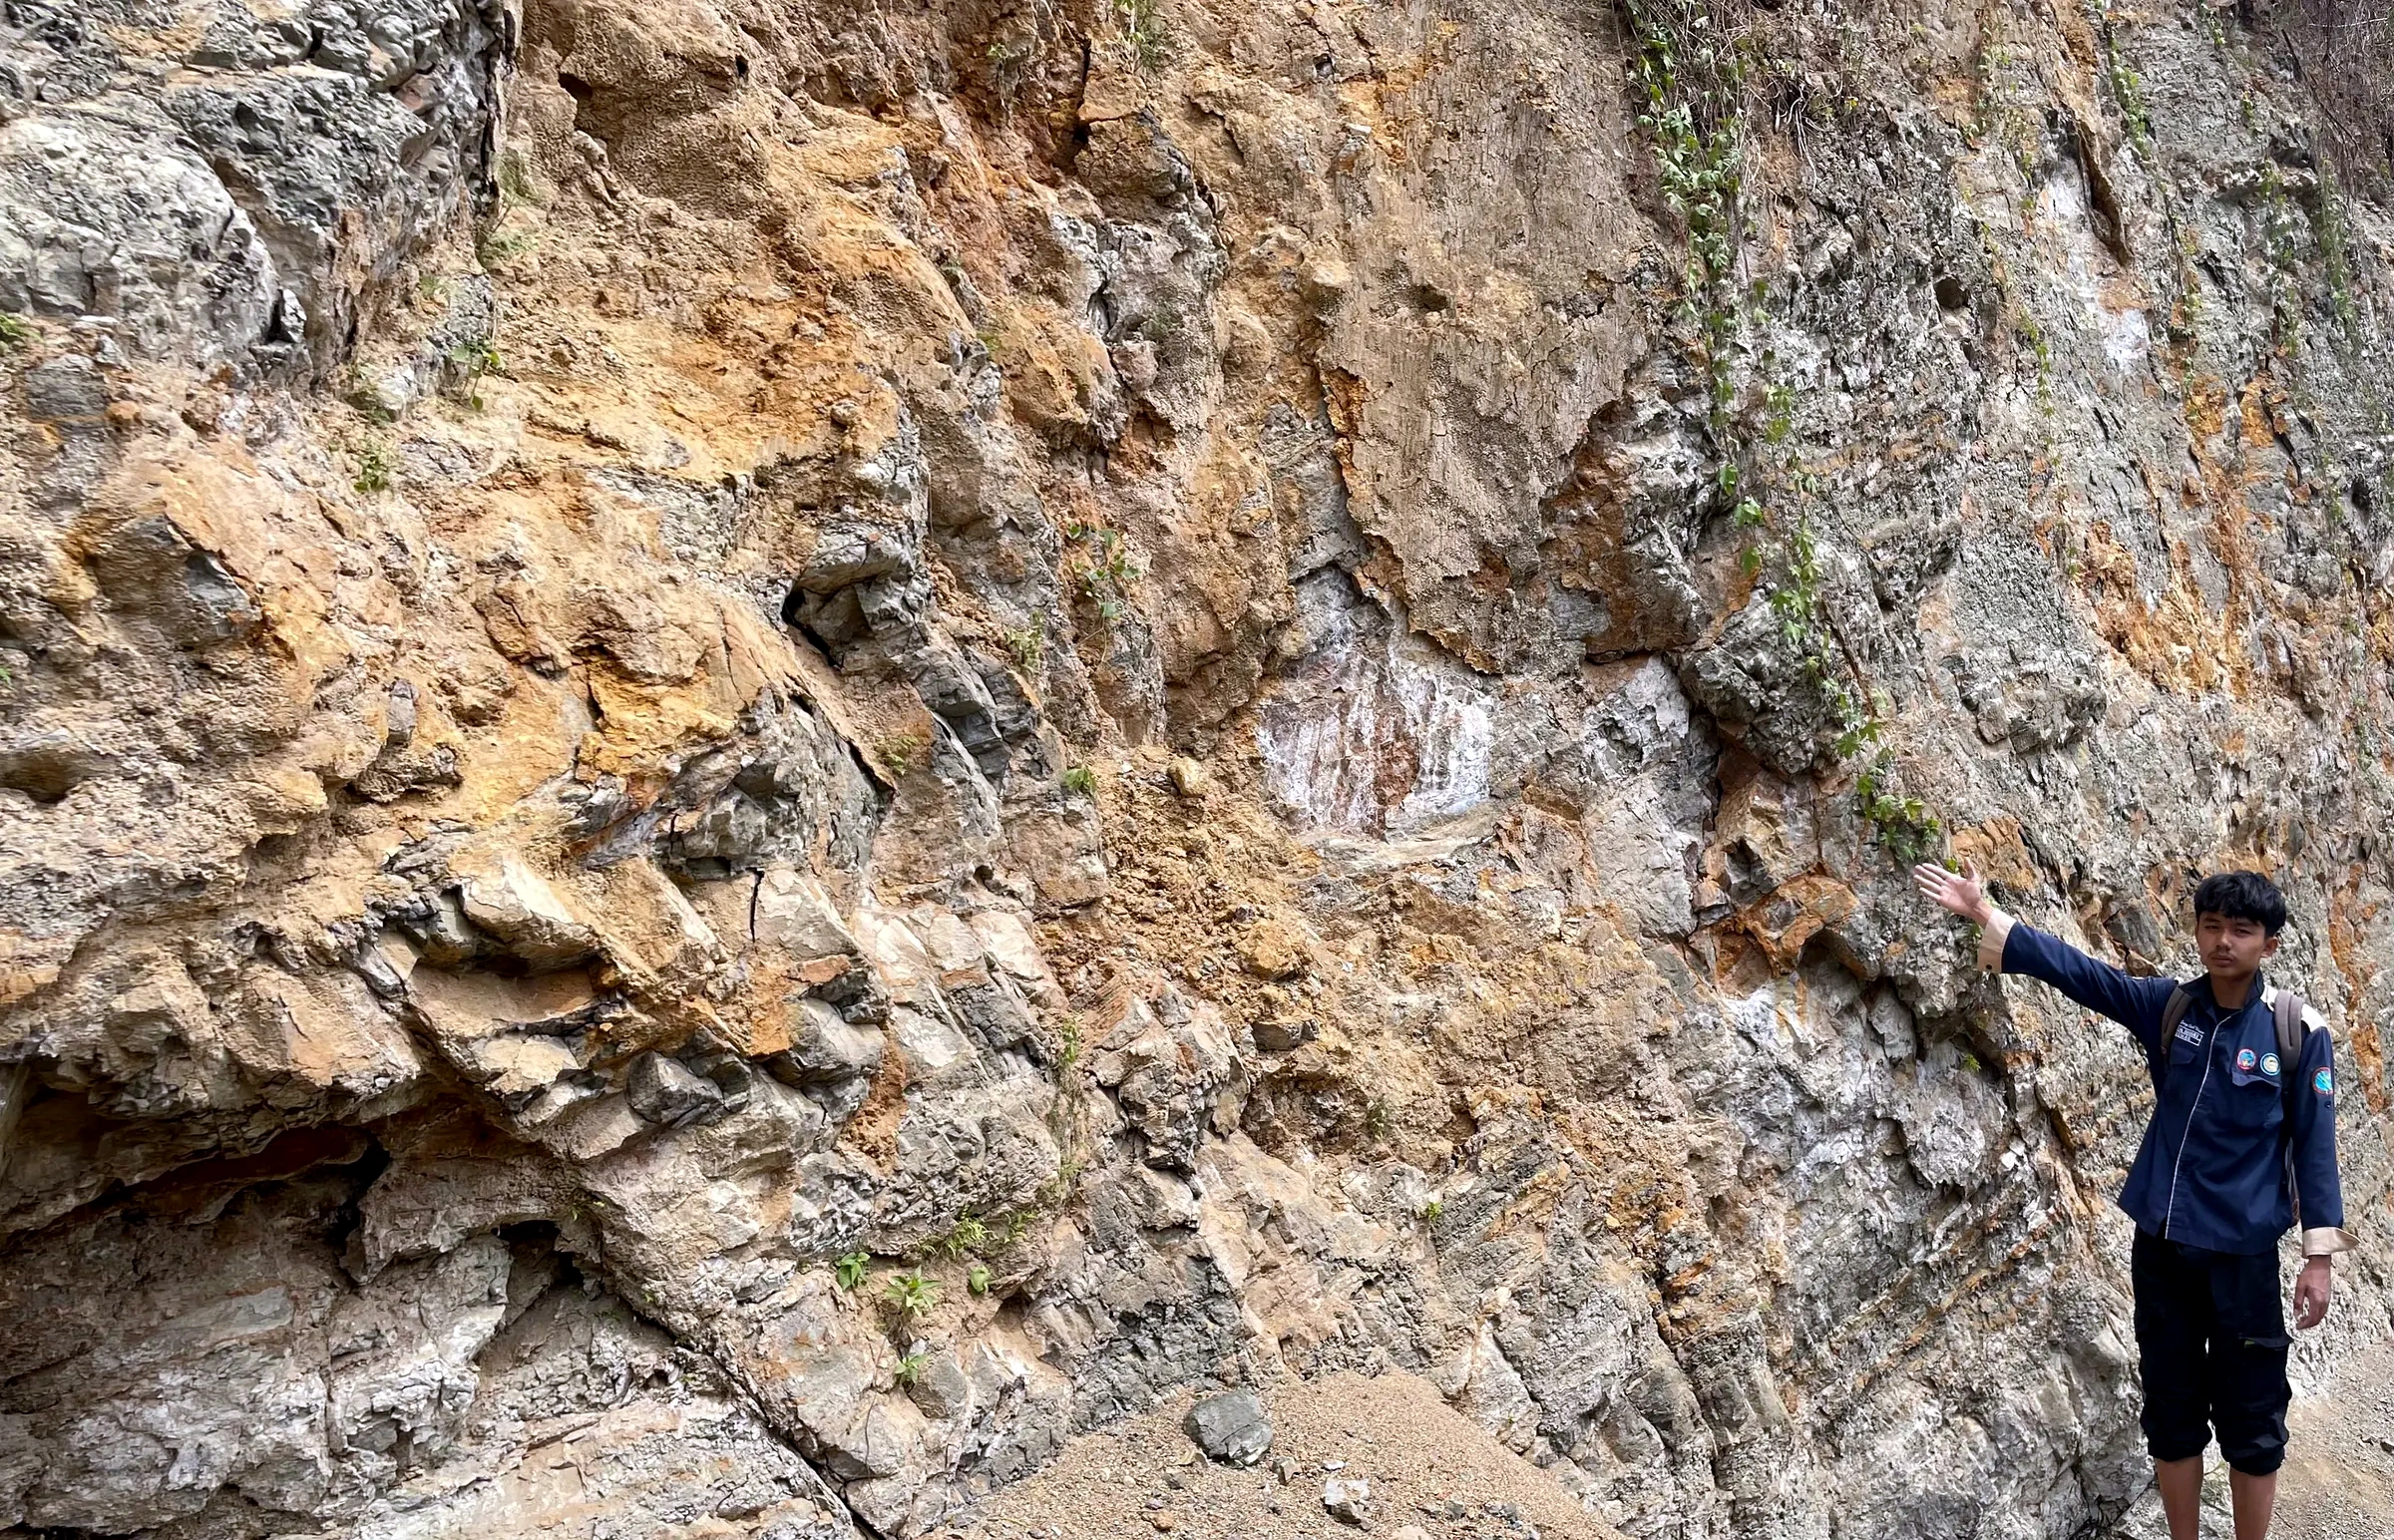
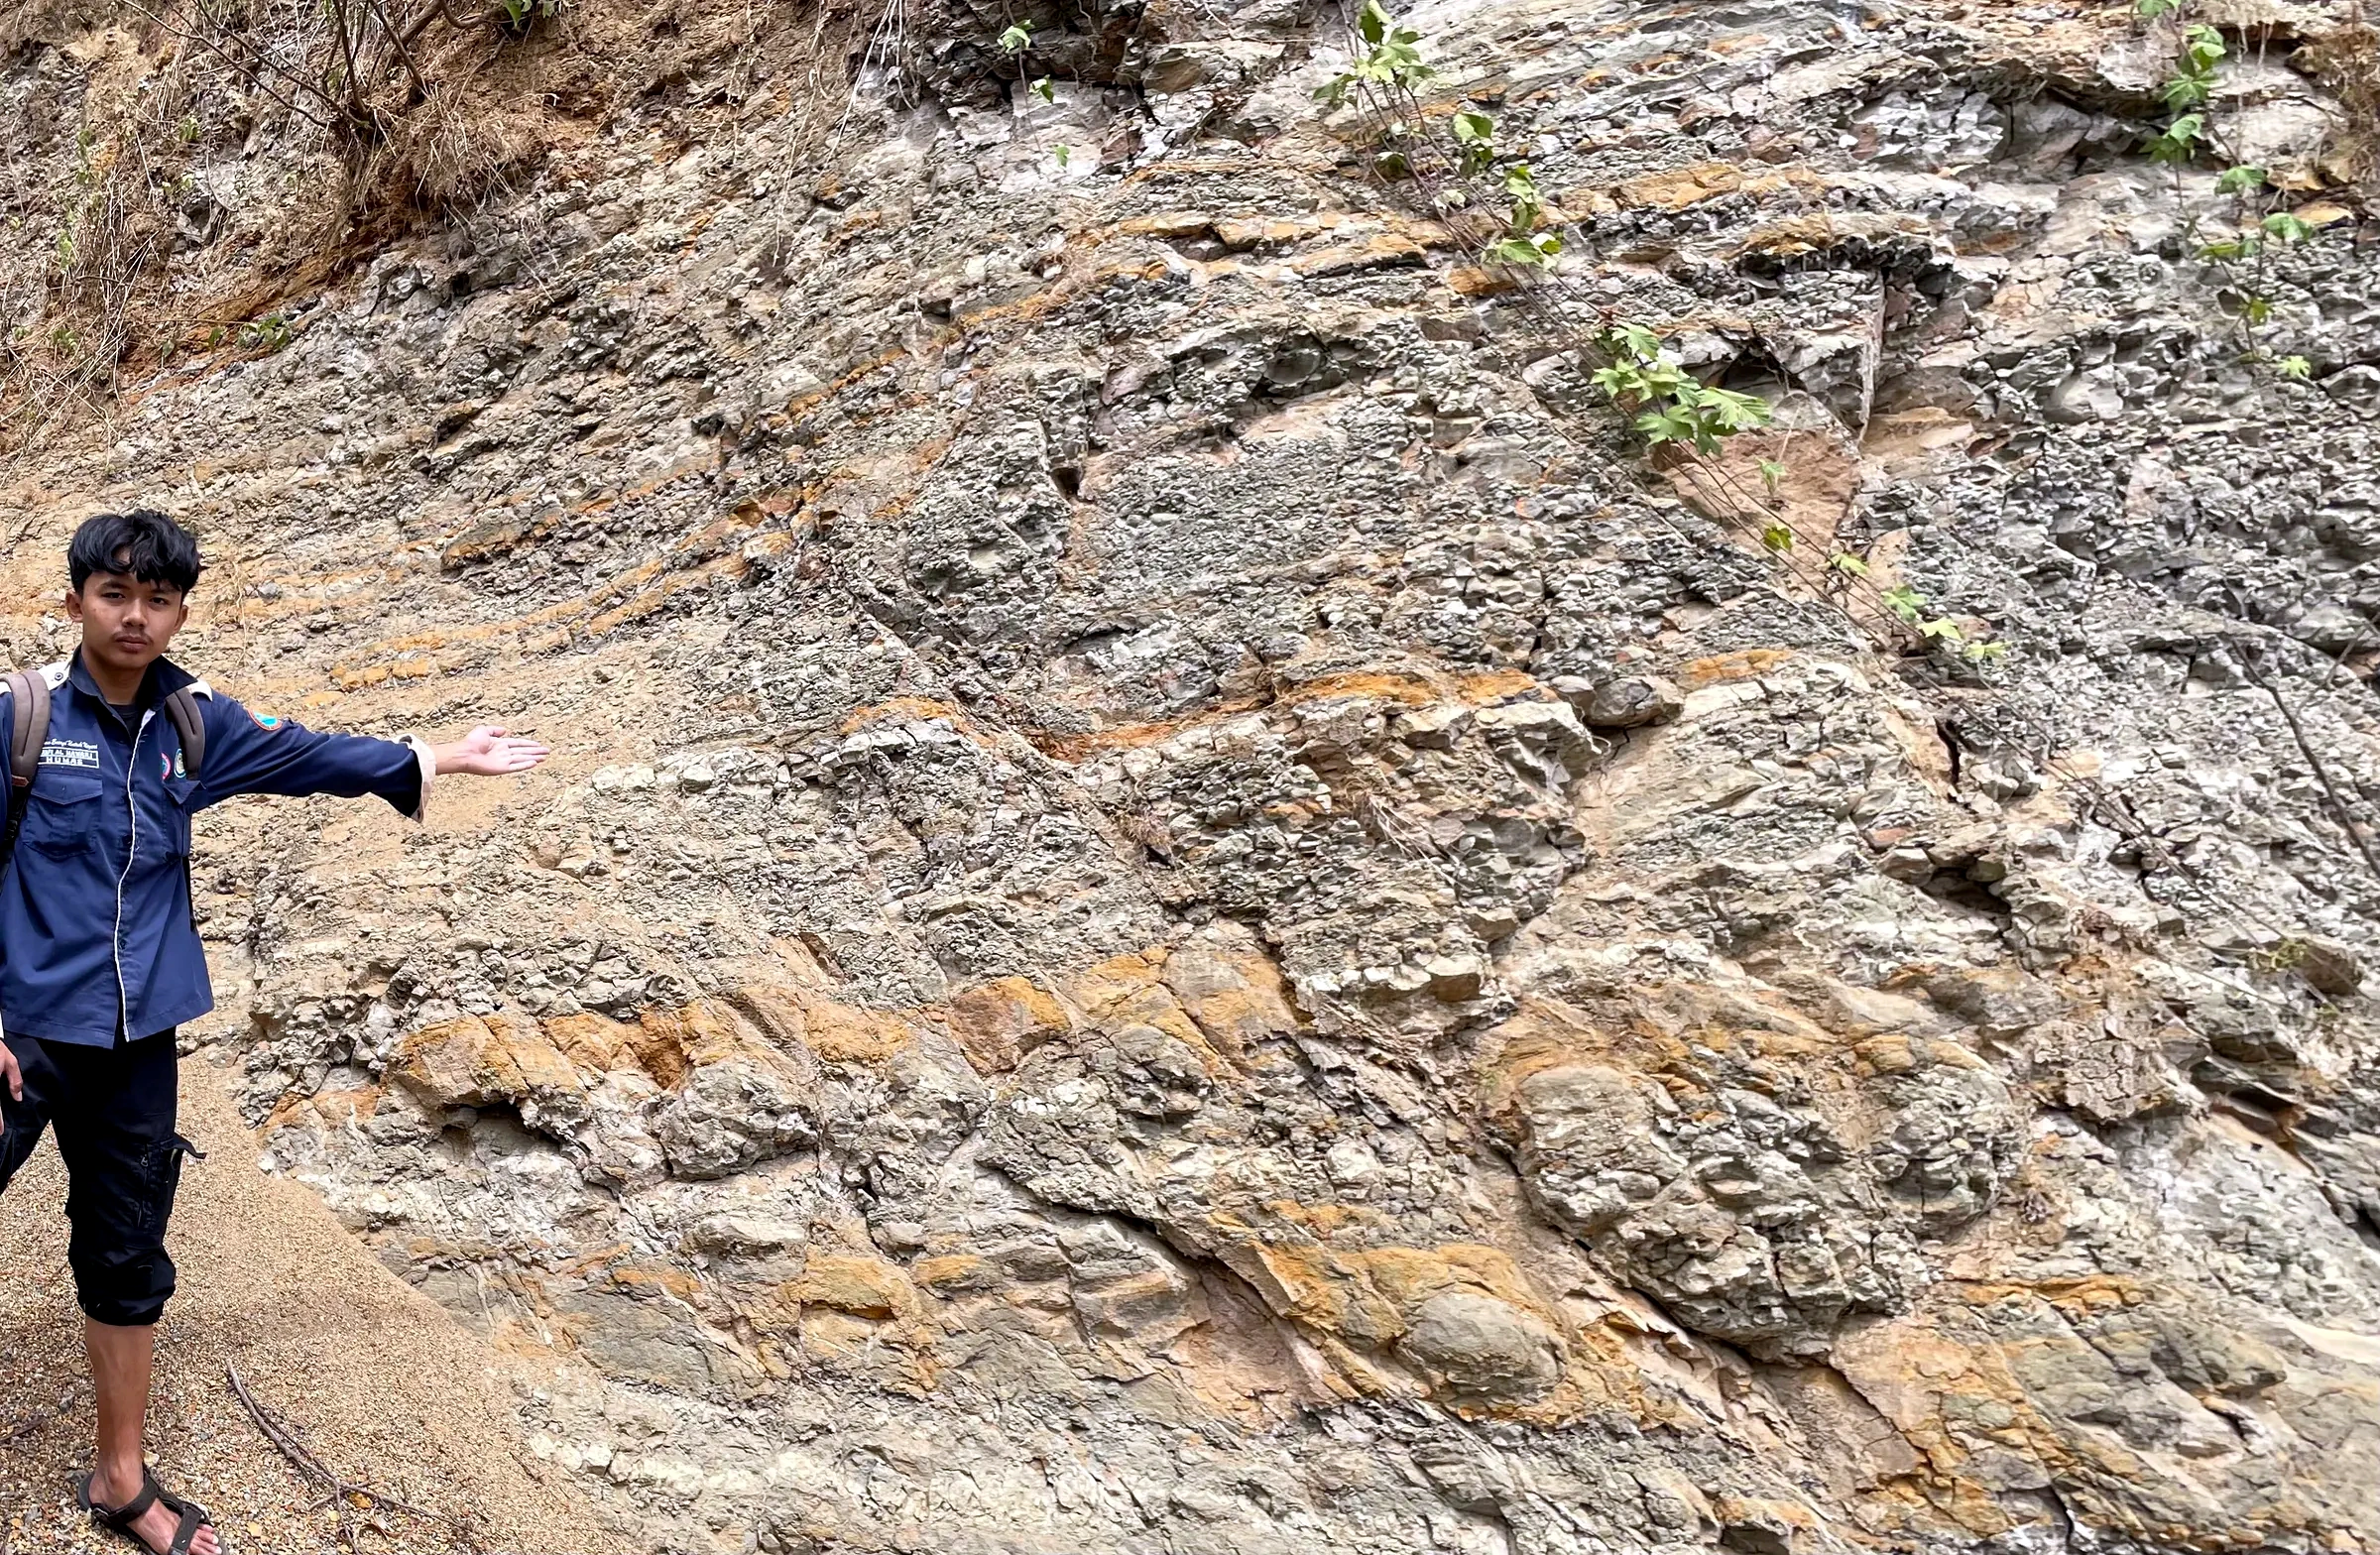
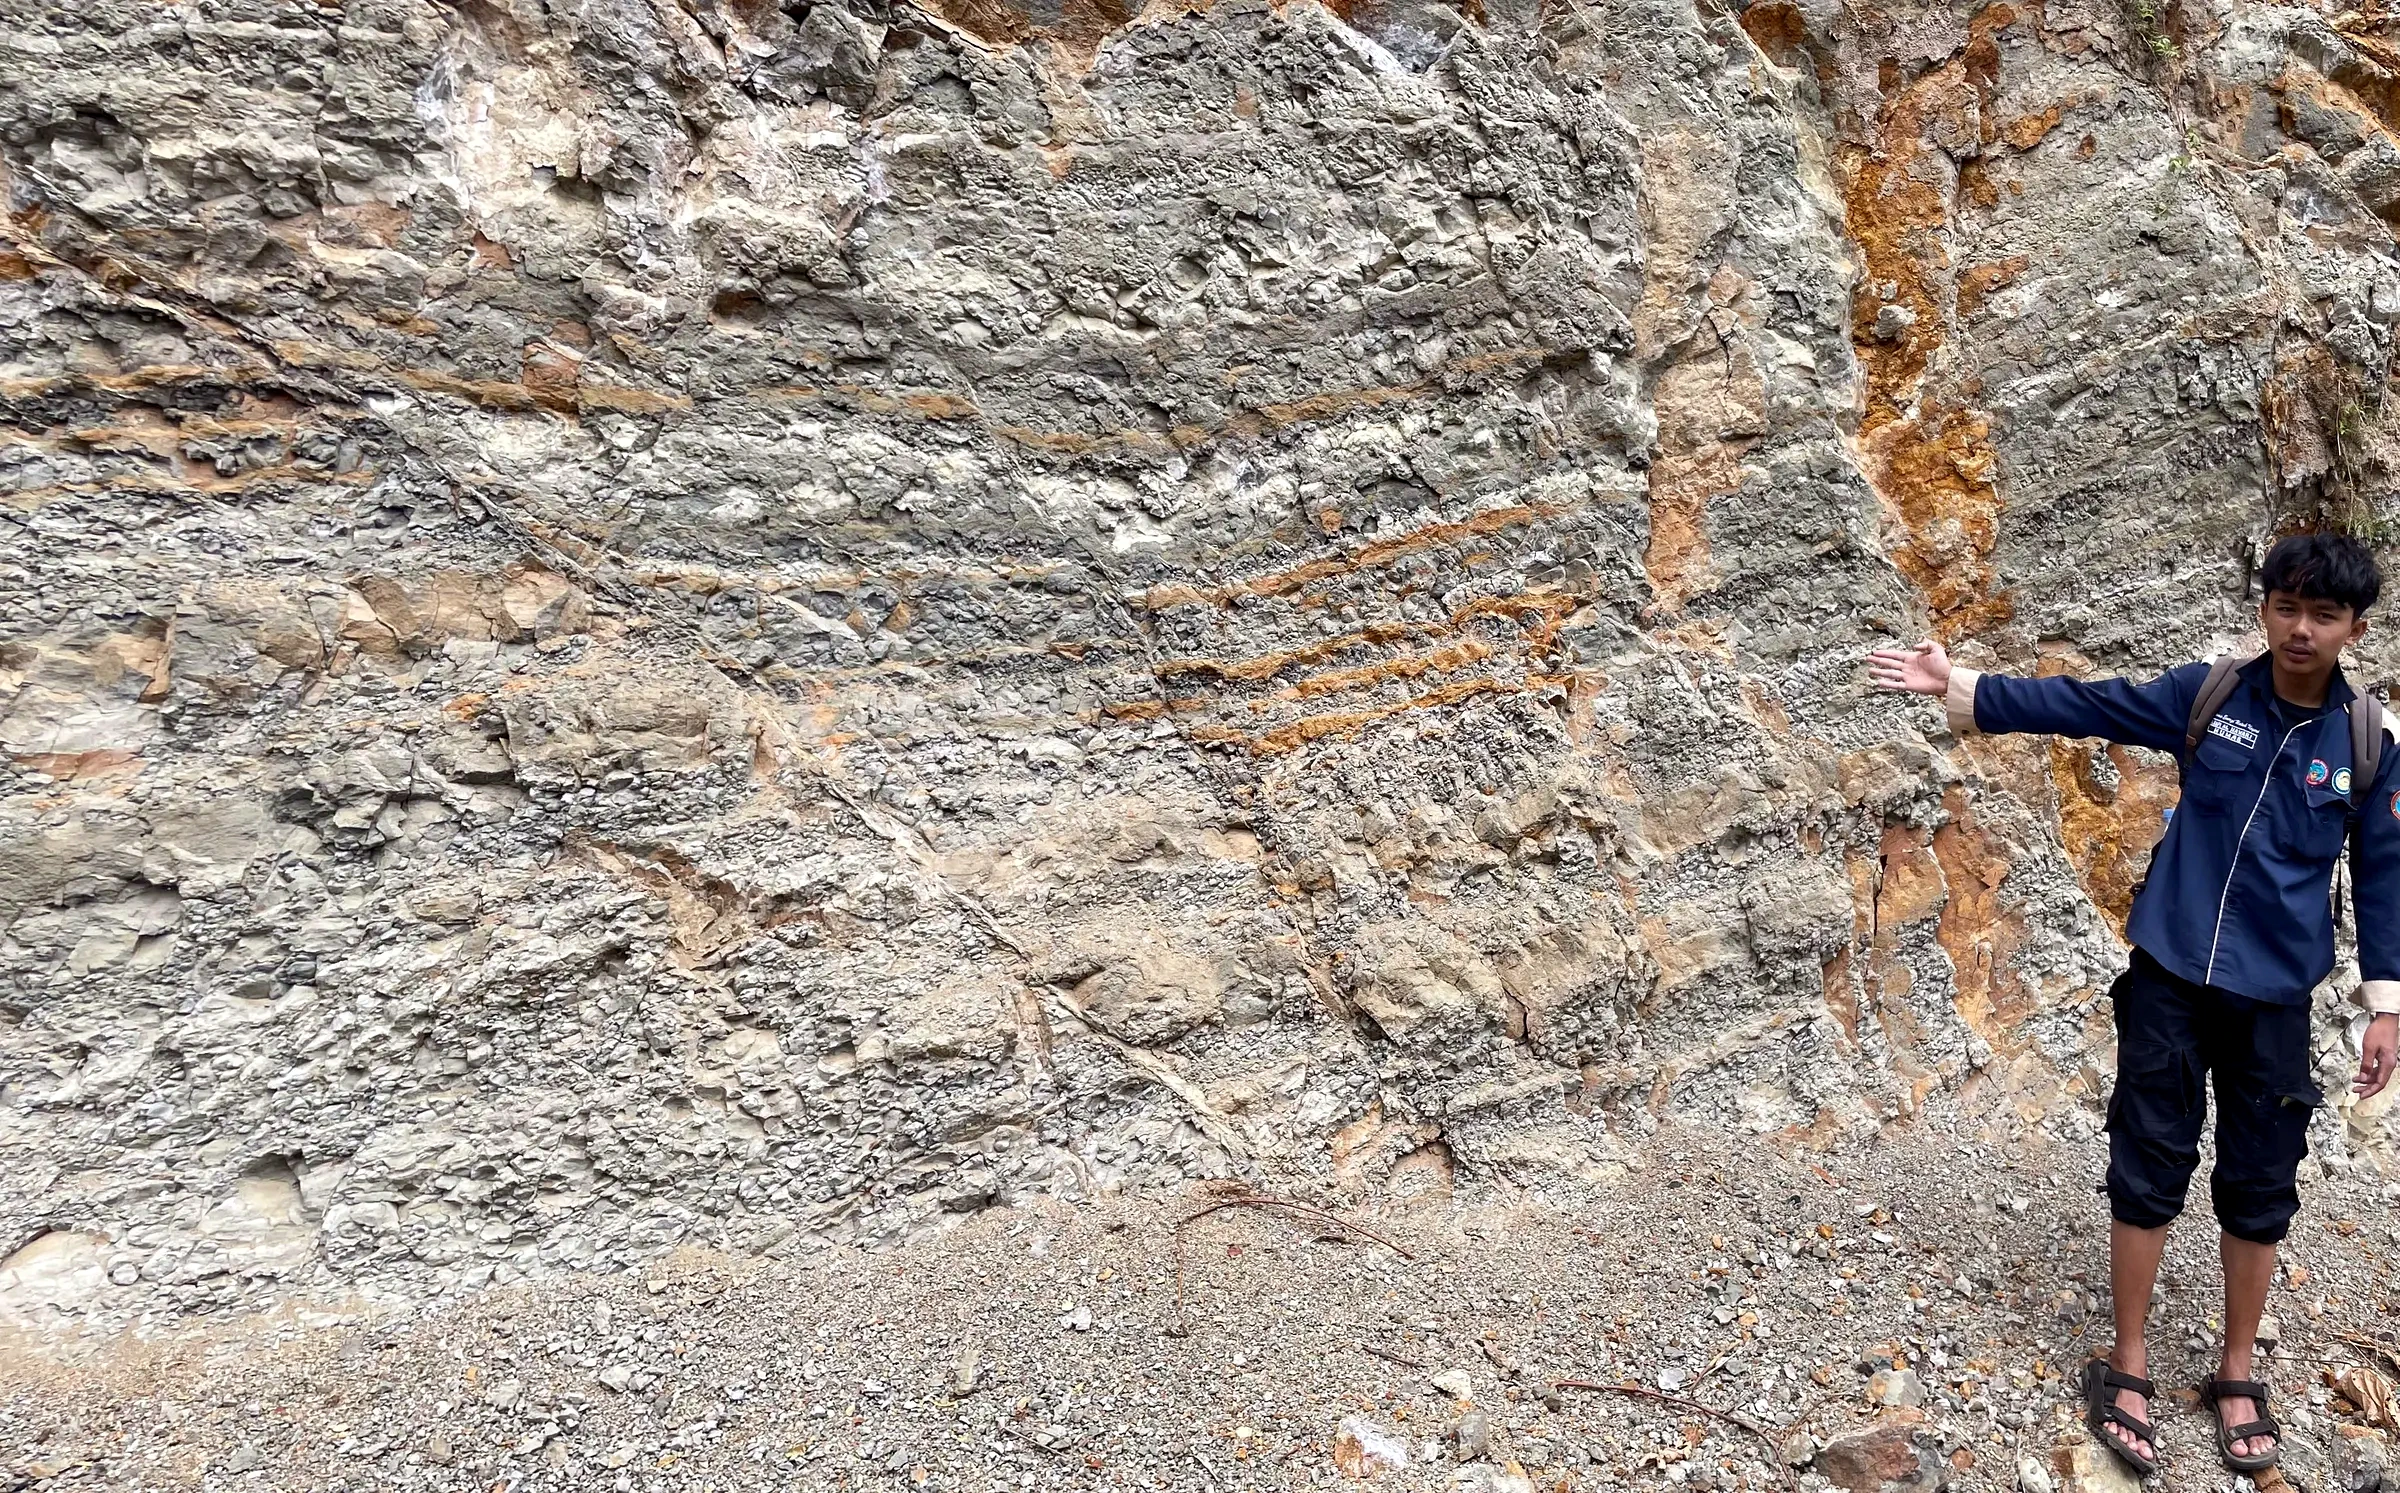
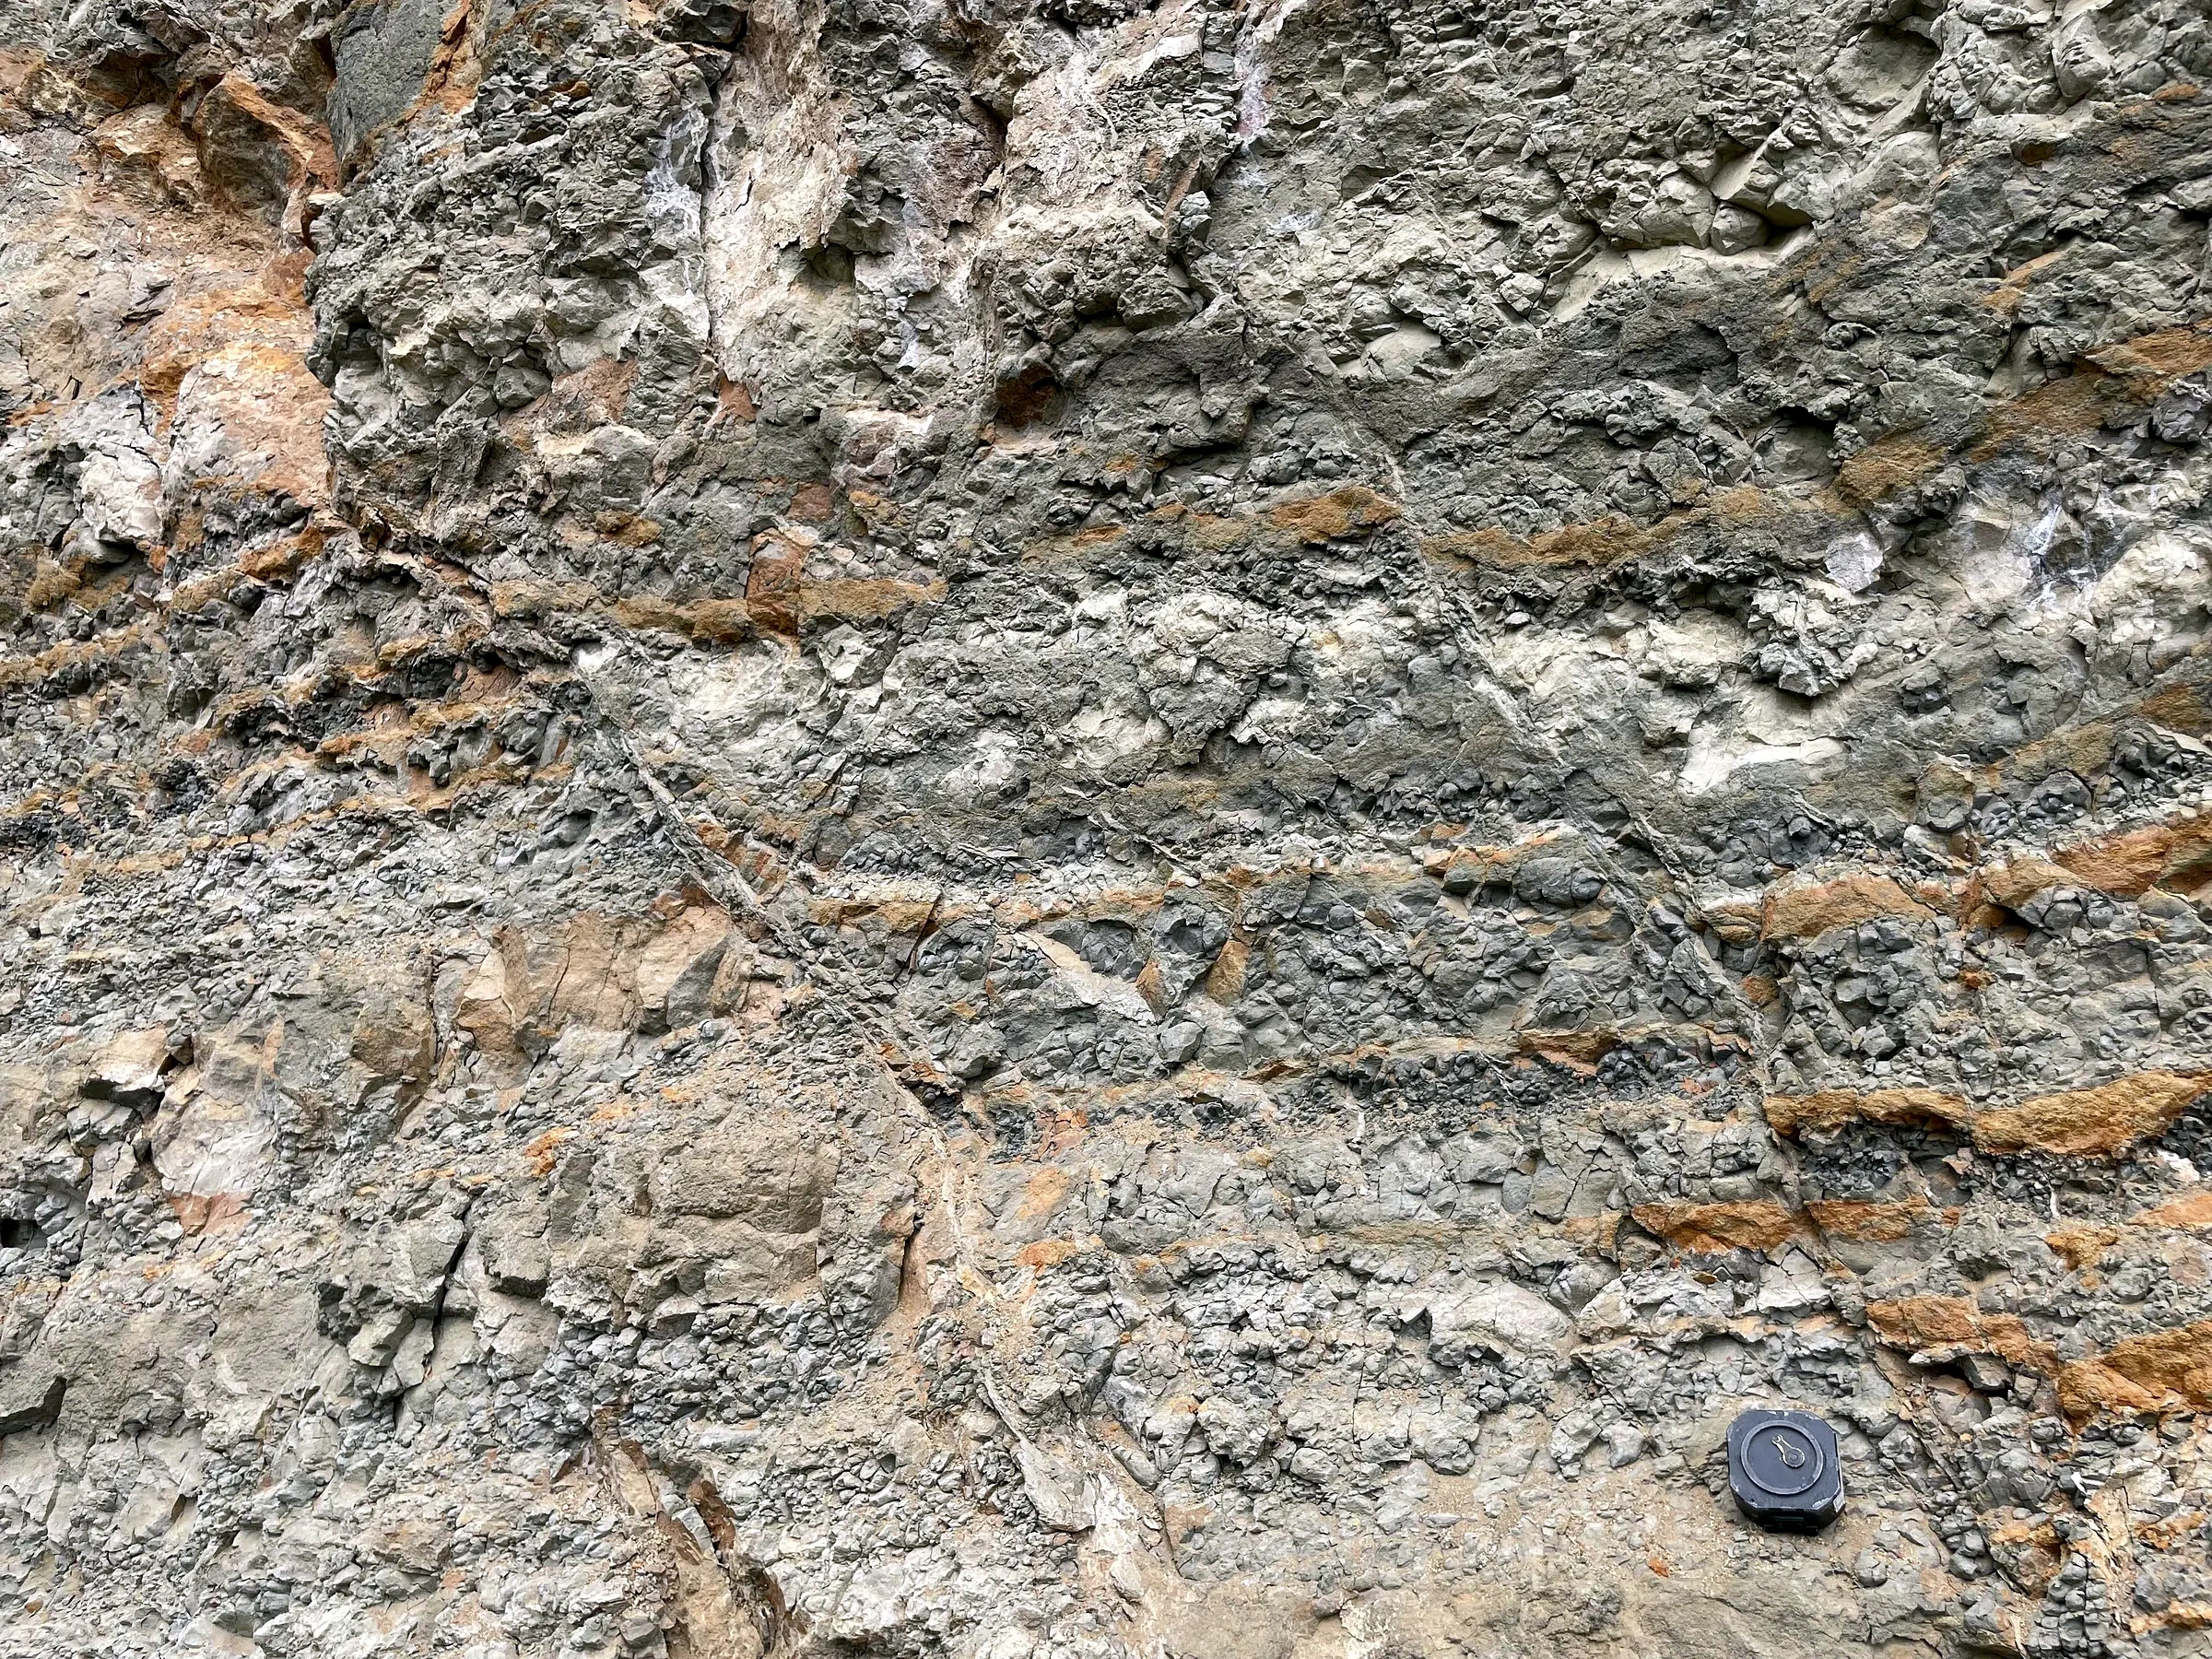
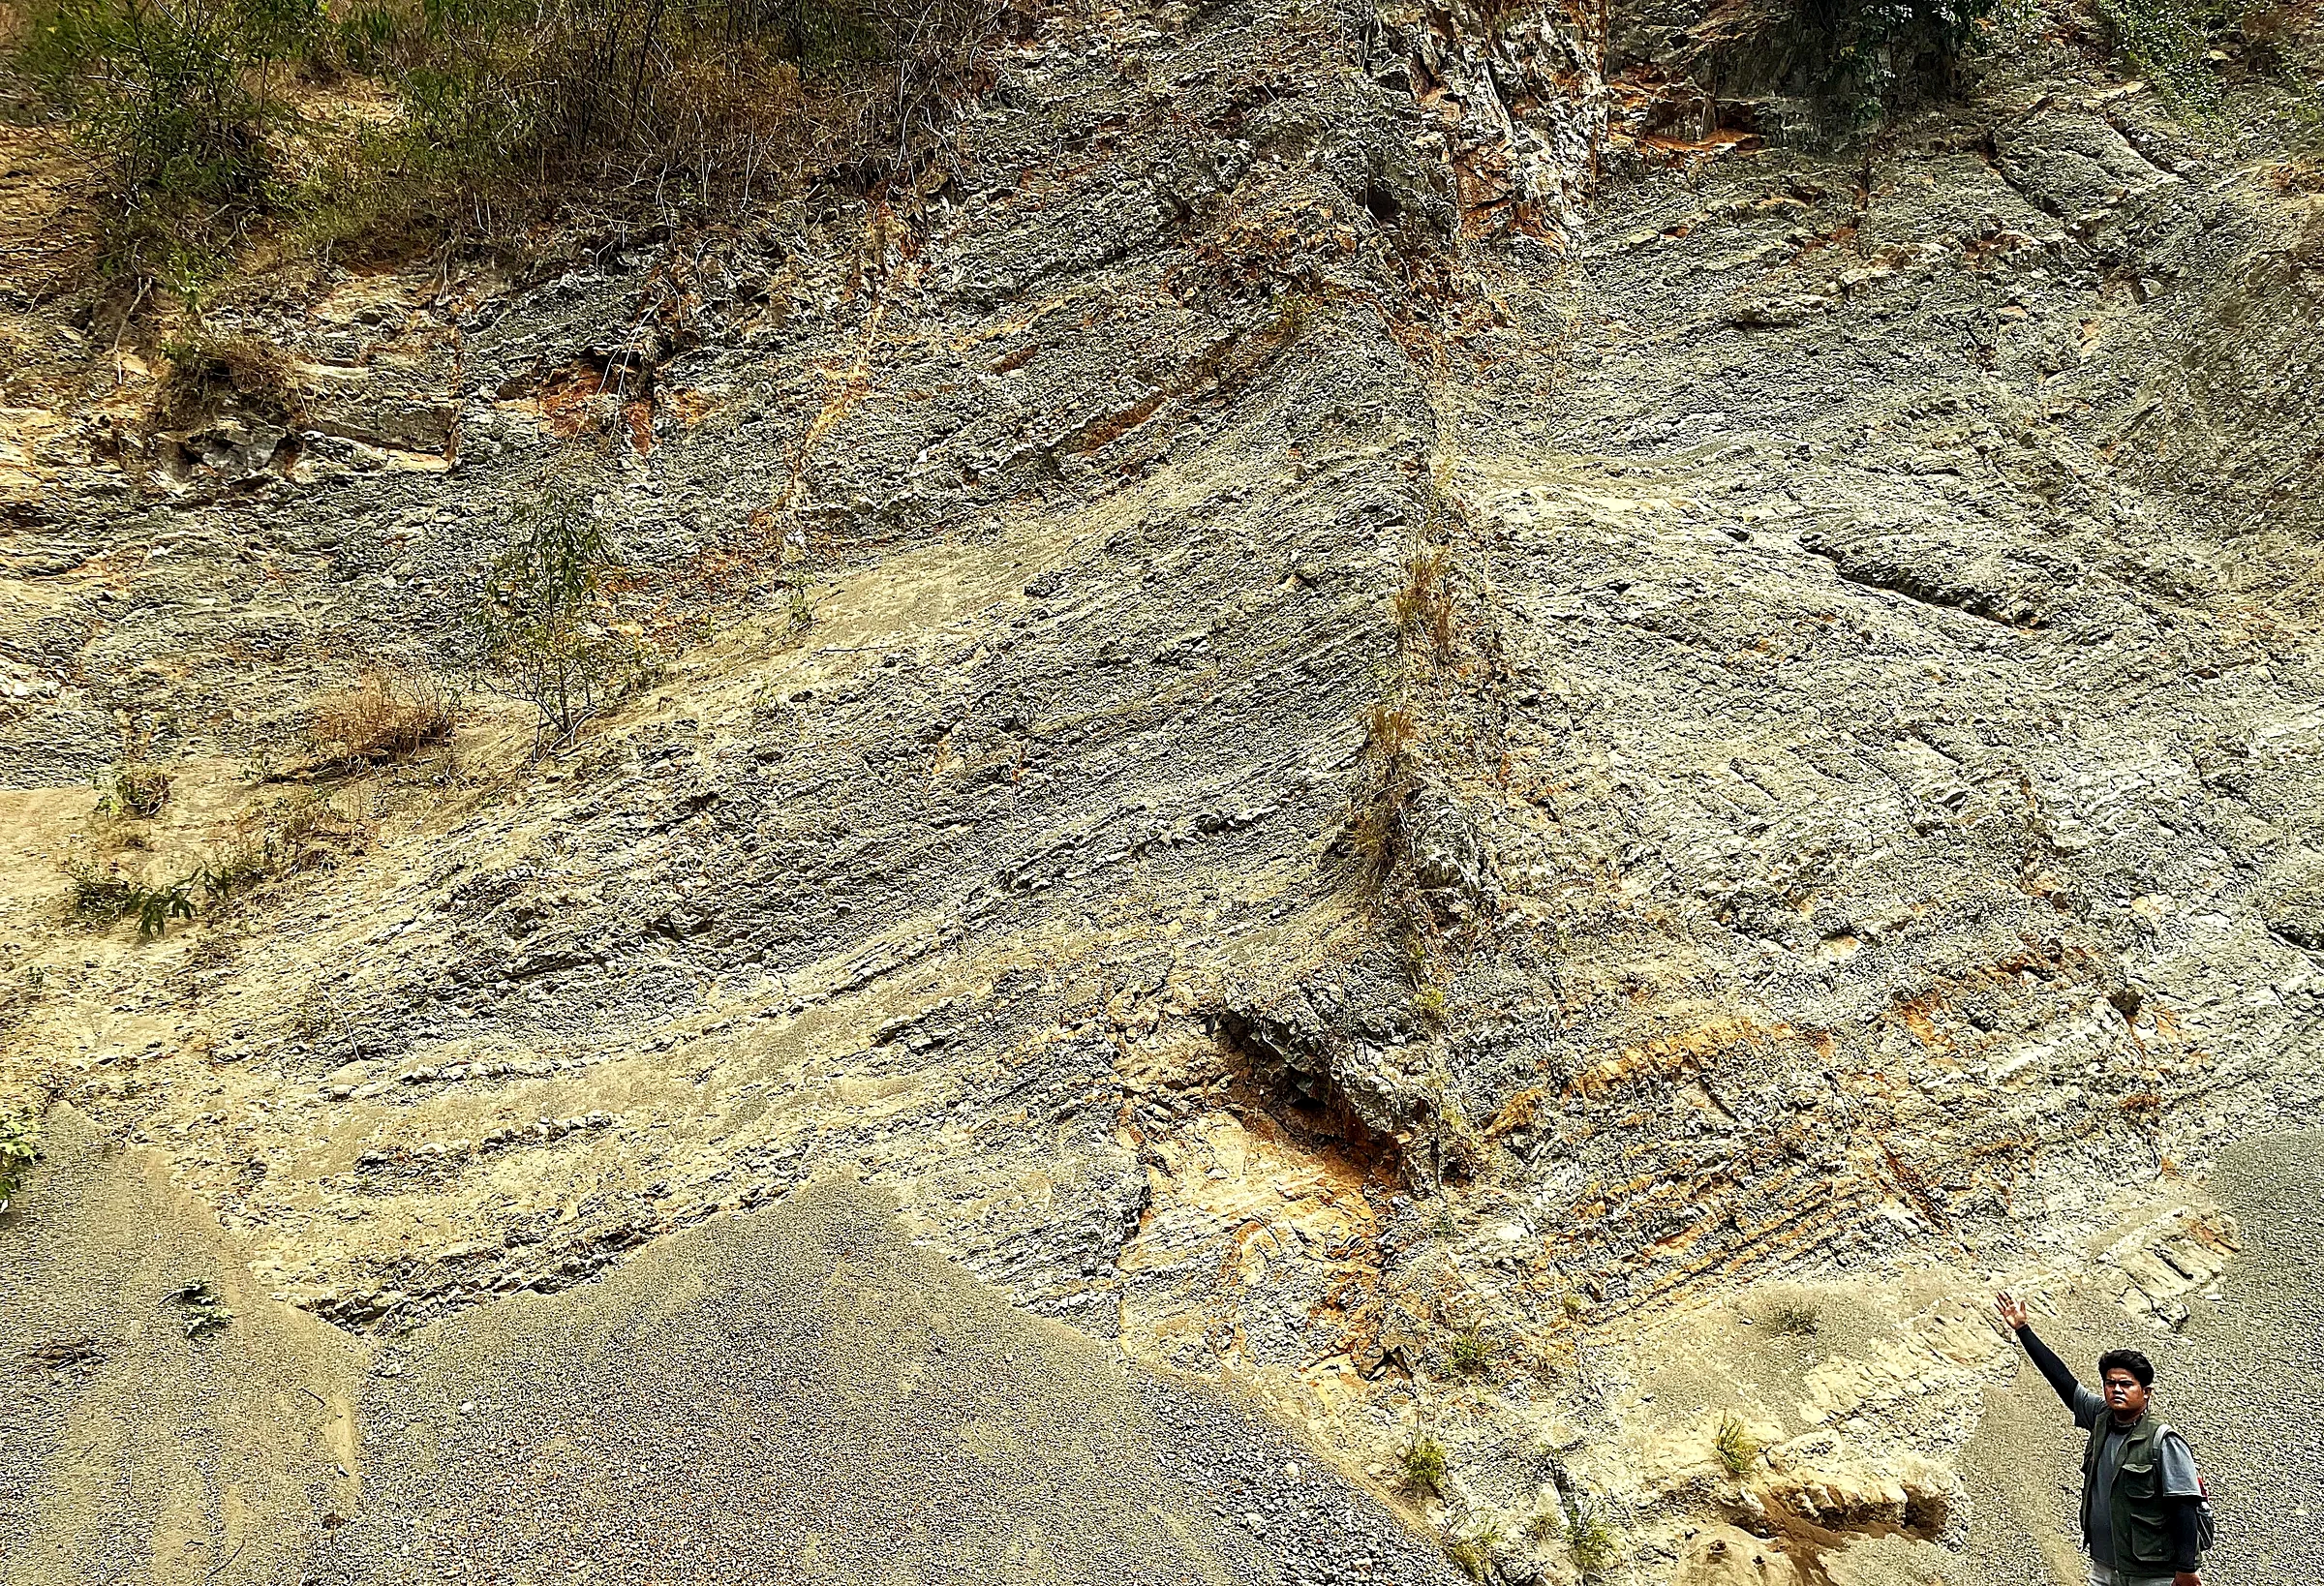
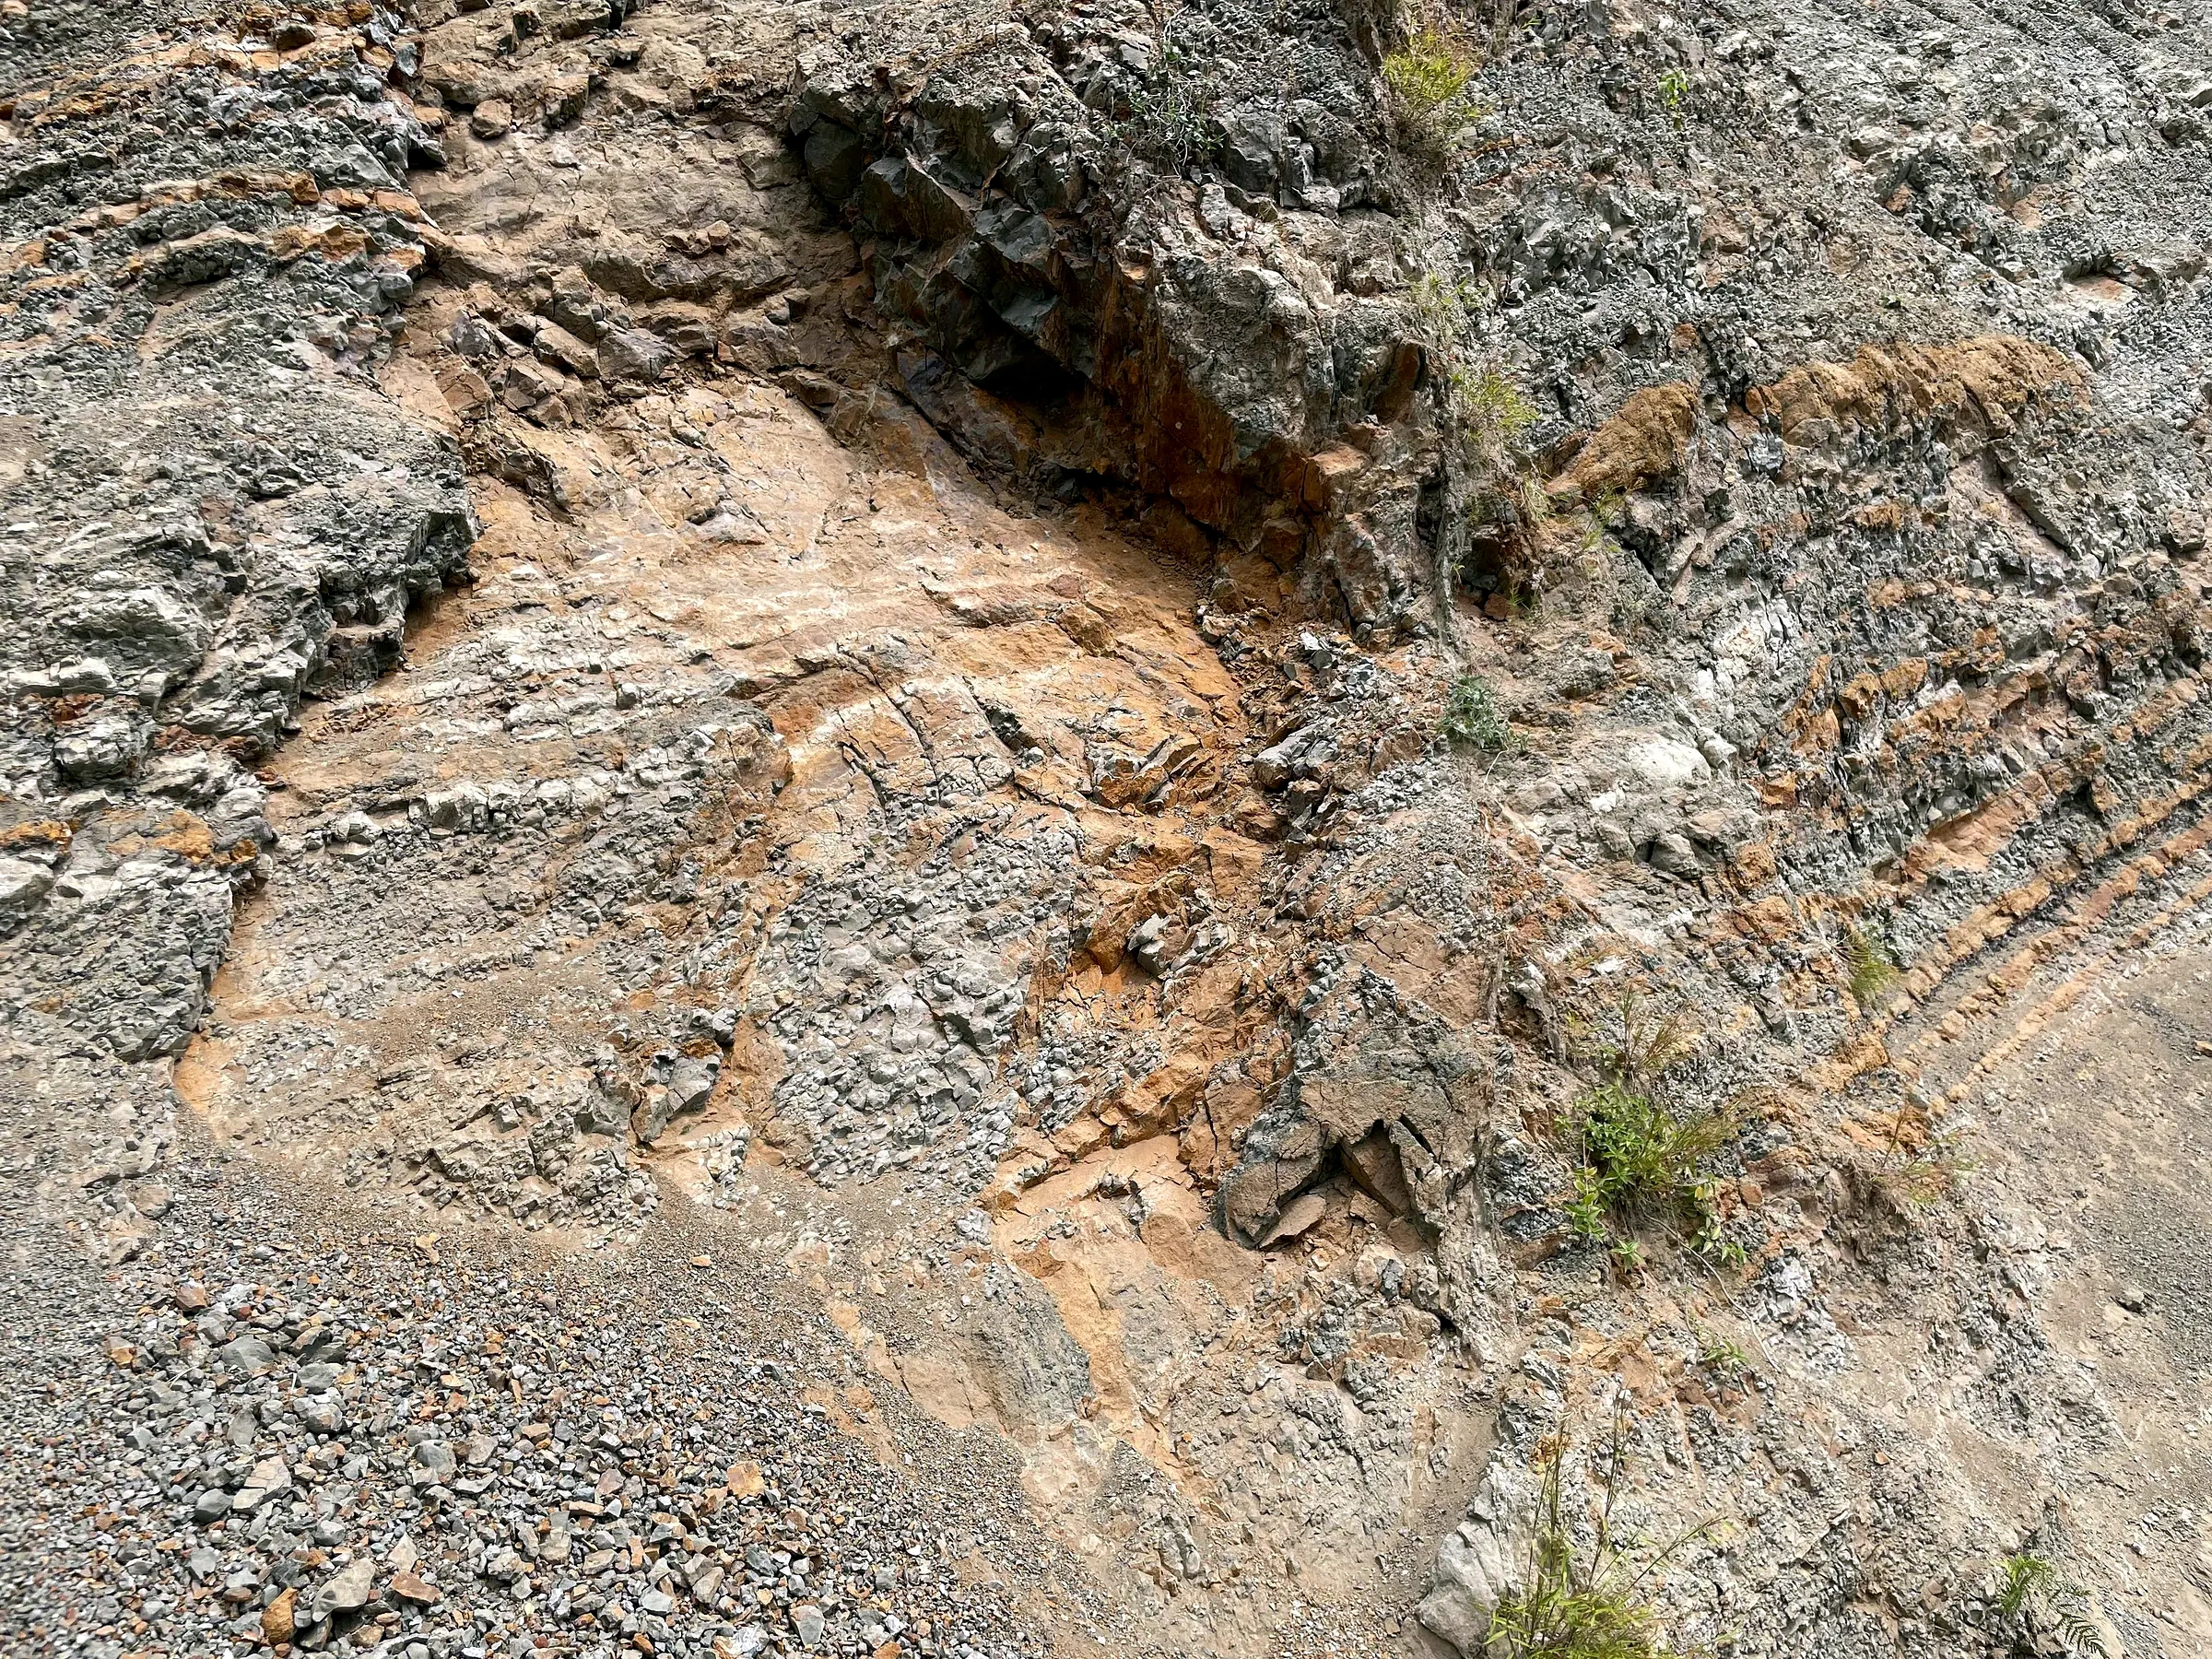
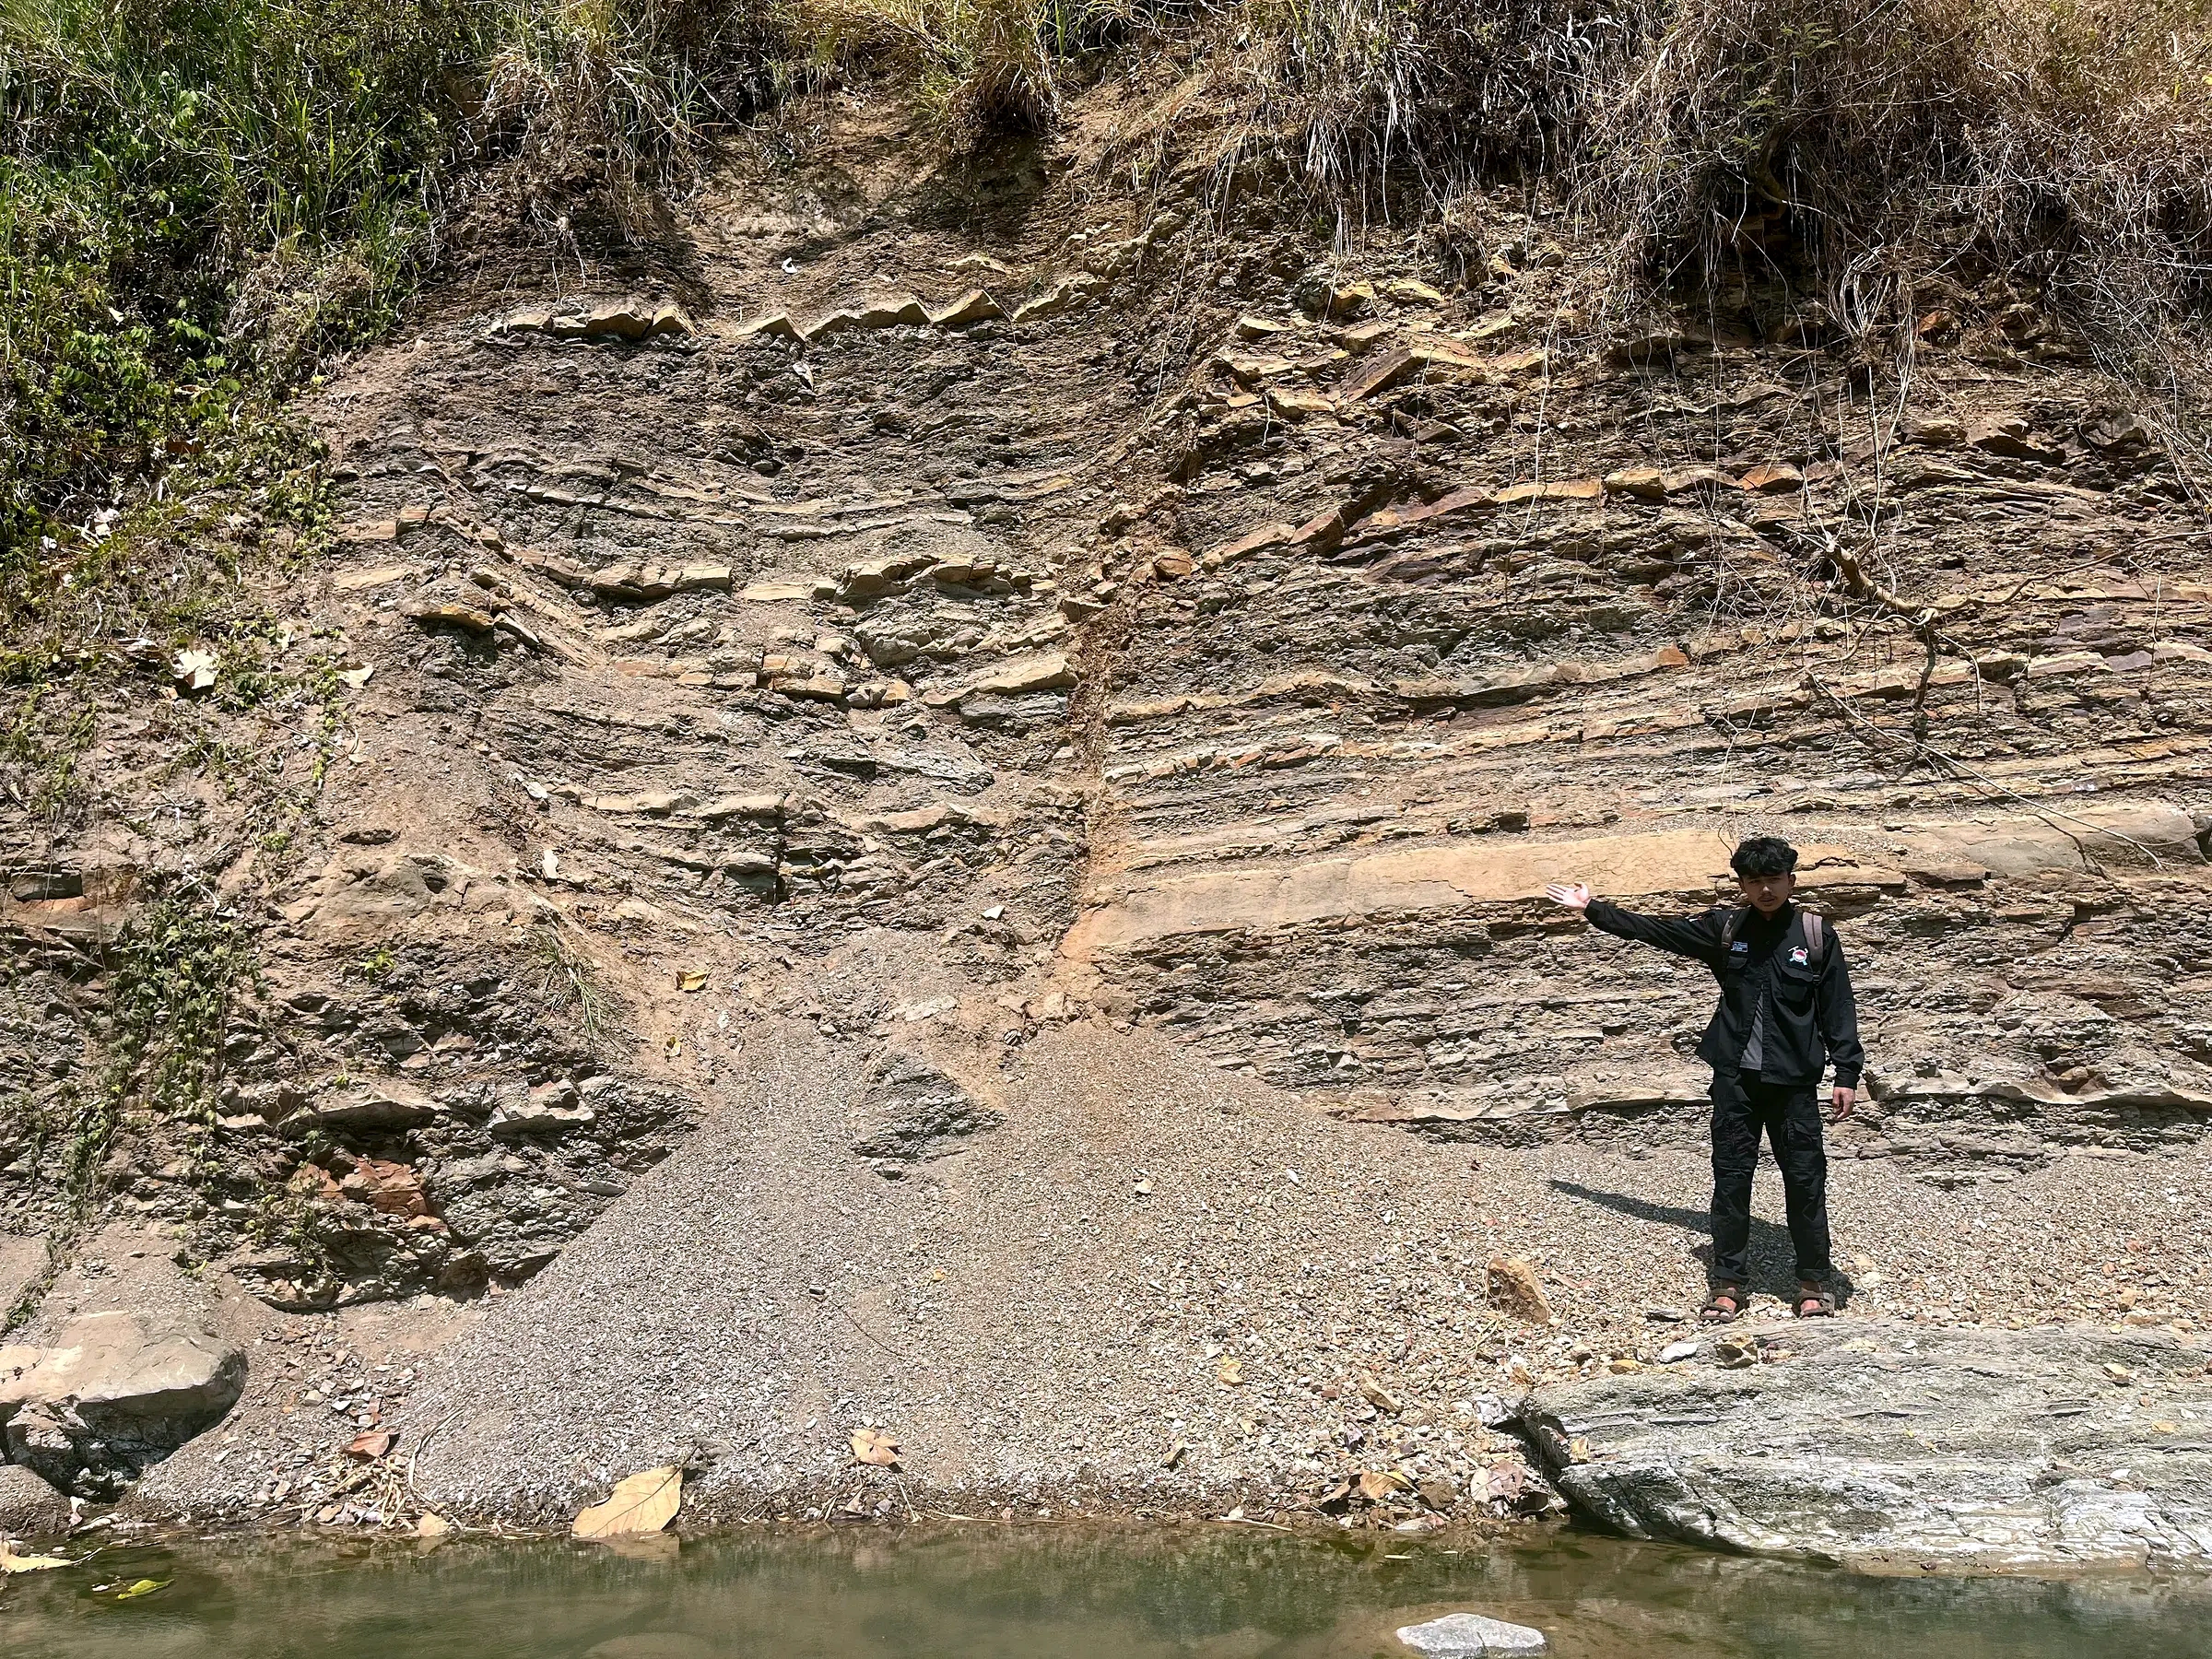
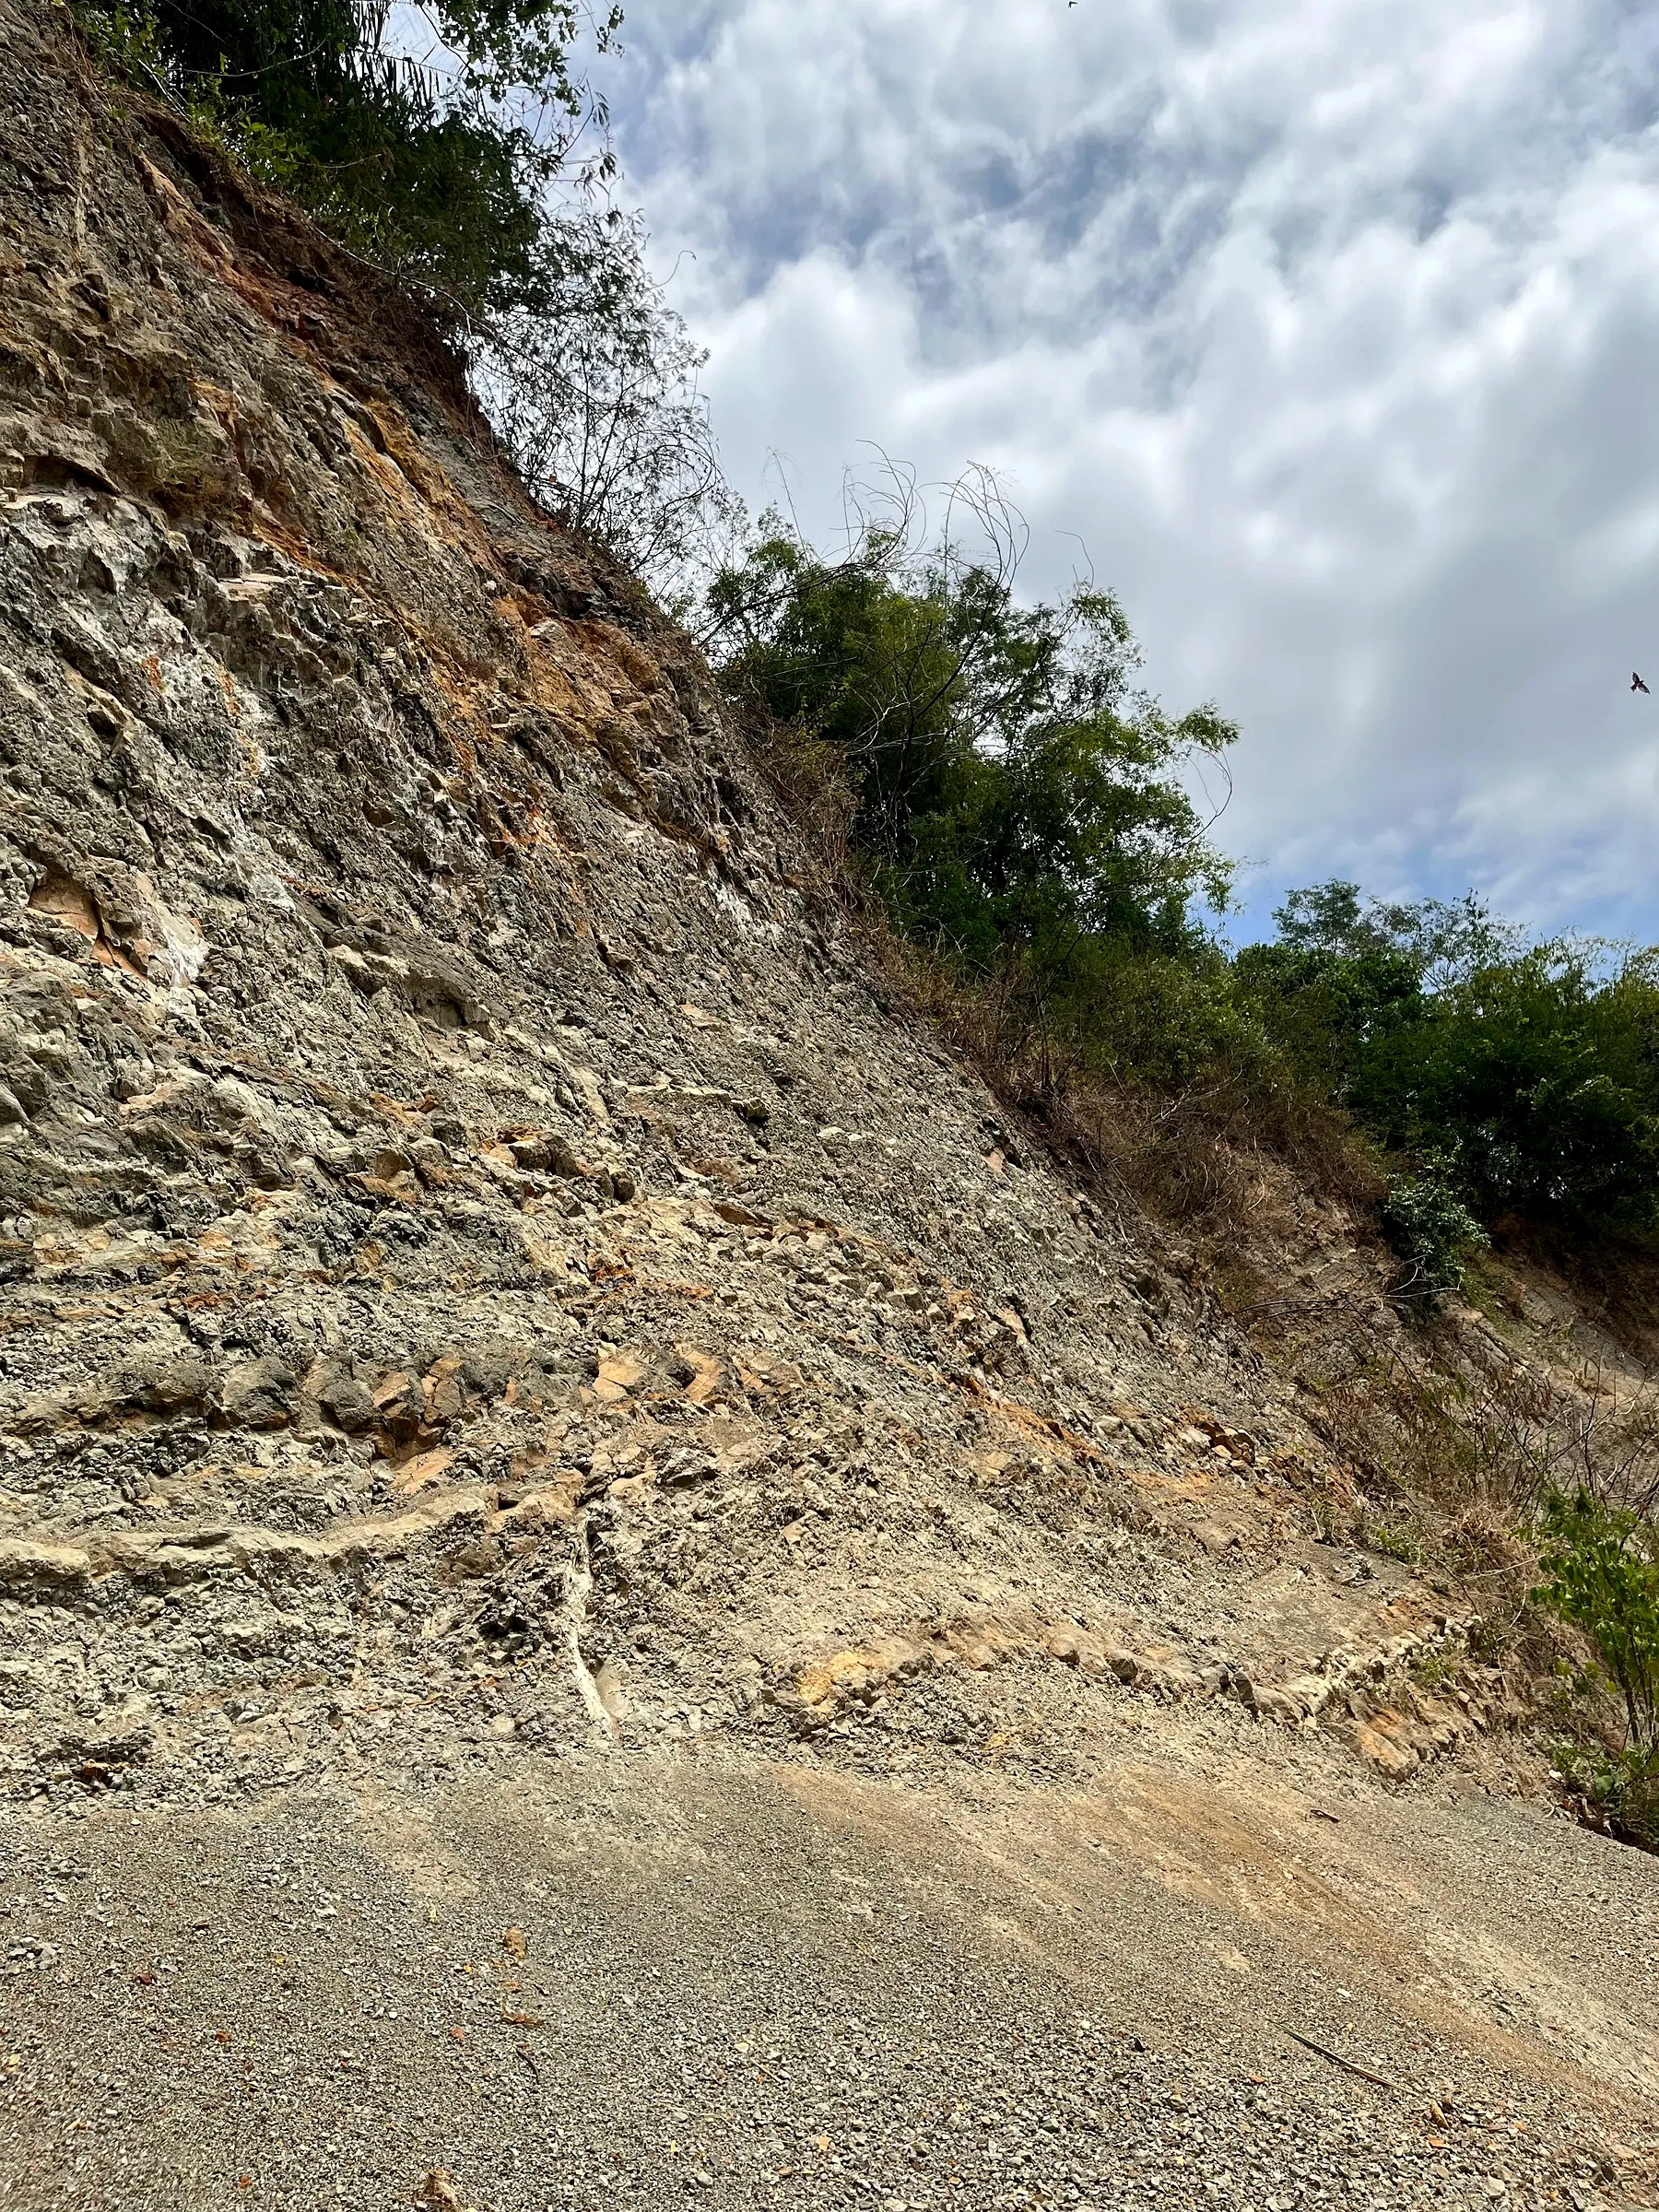
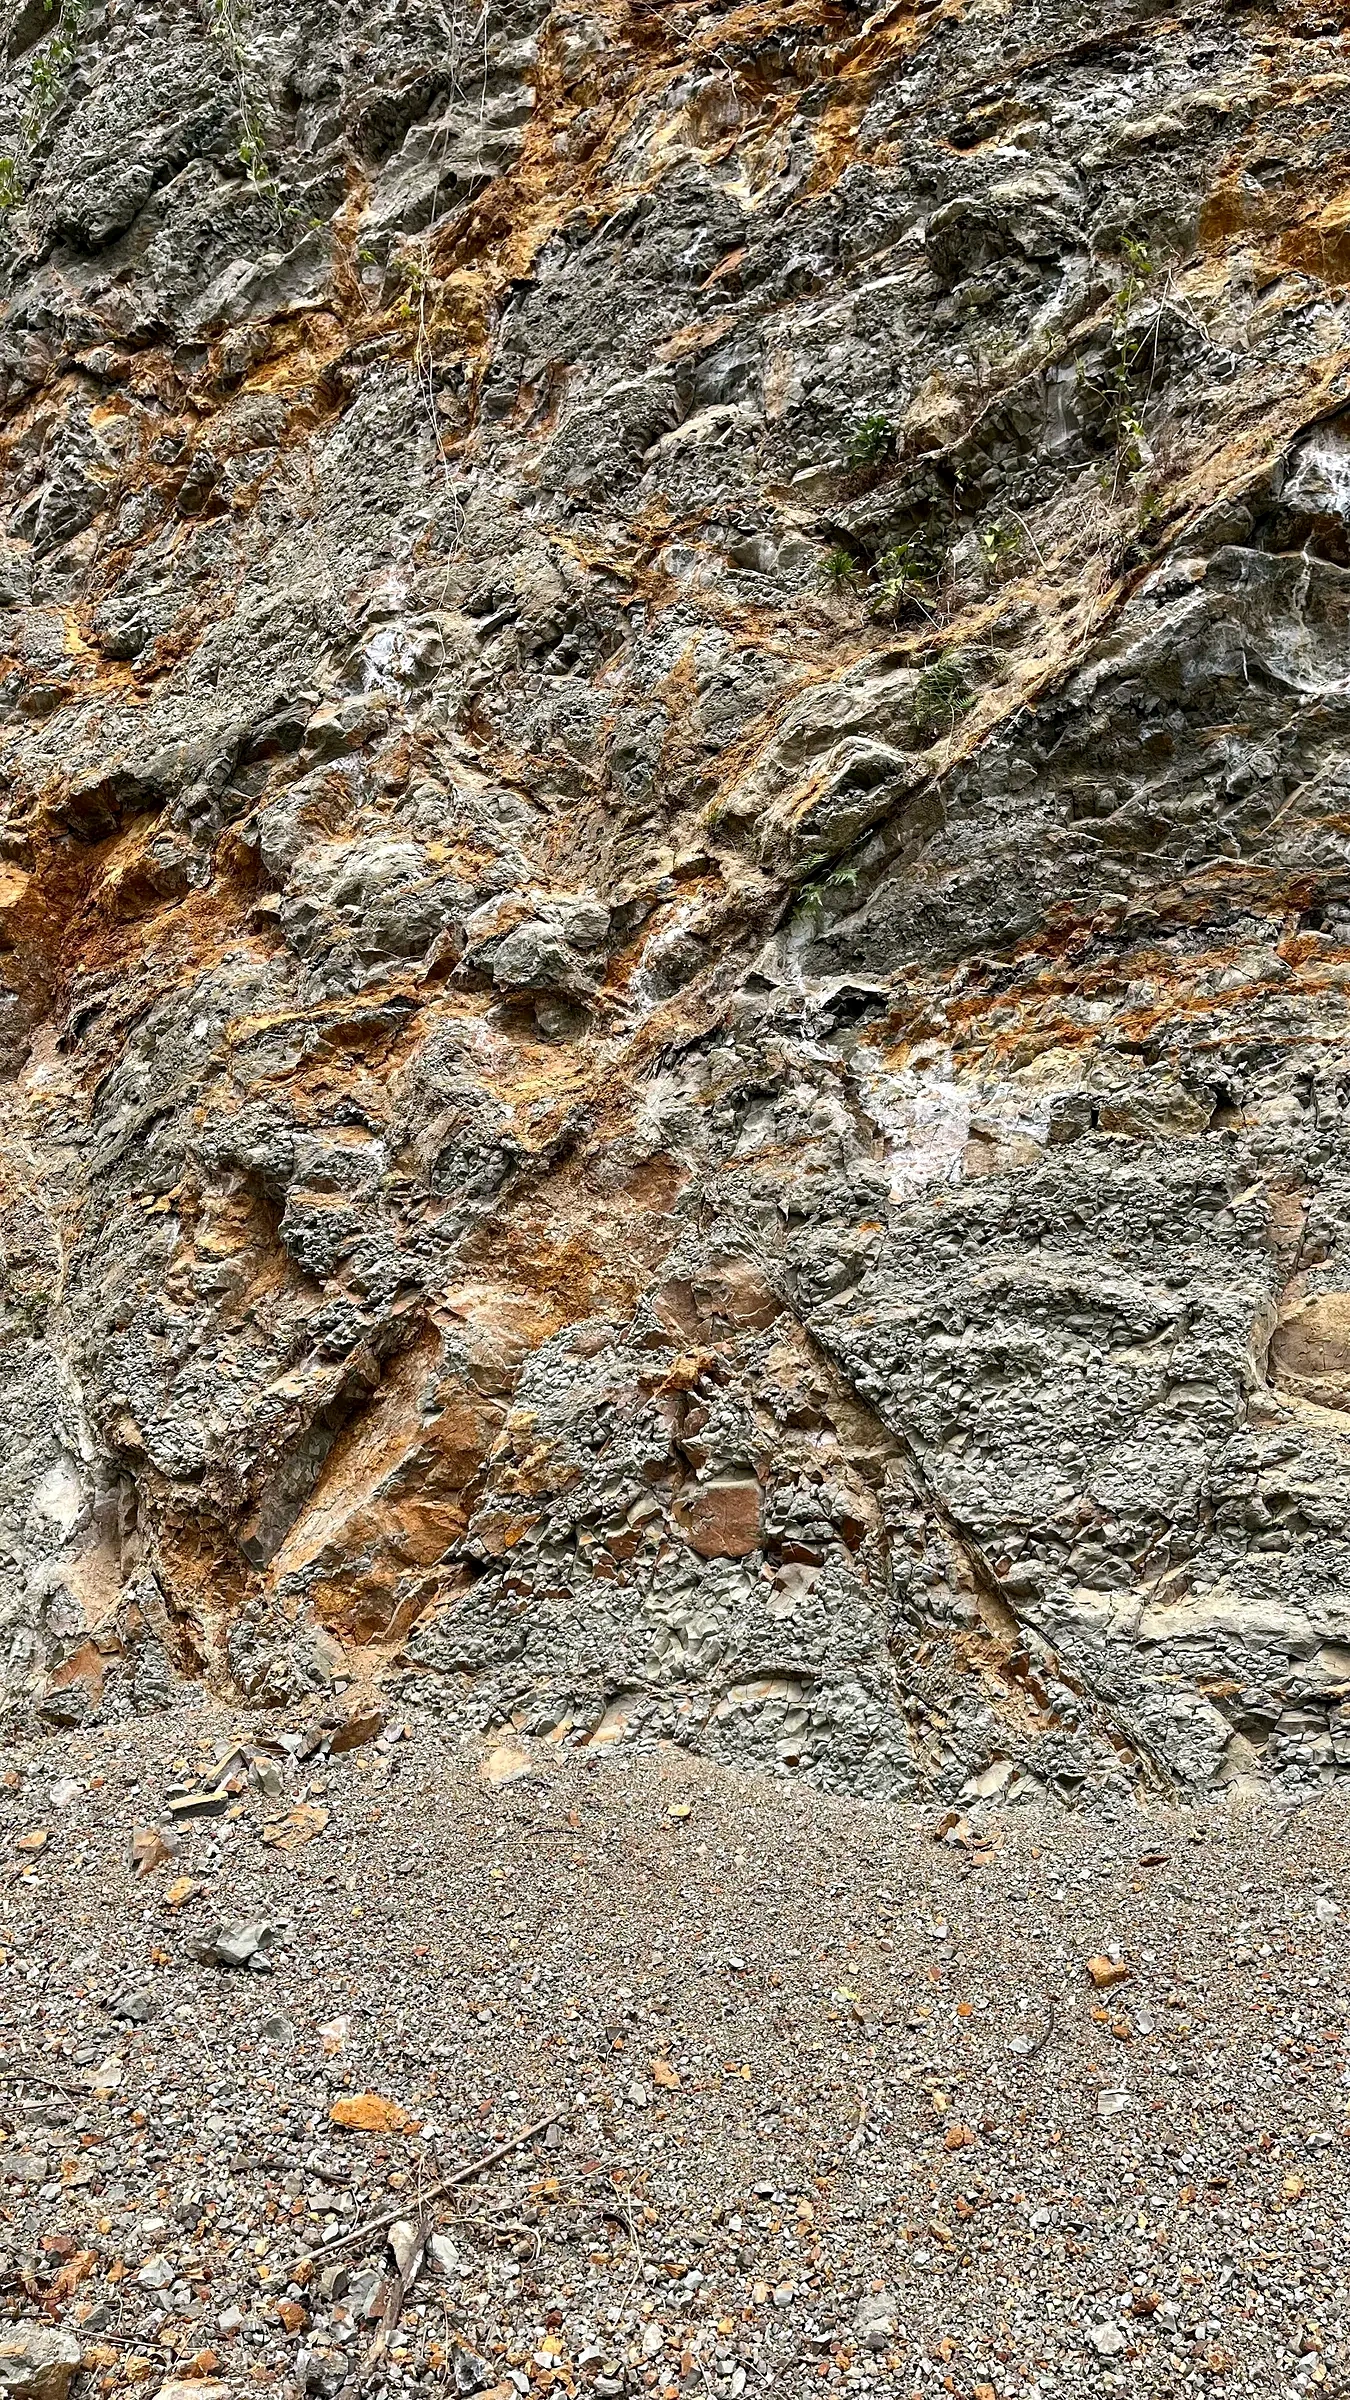
The Sukarapi sequence is hosted by Halang sandstone–claystone interbeds, not by a breccia unit. The photographs move from coherent bedding into steepened, folded, fractured and locally disrupted rock, while LP81 supplies the diagnostic structural record: a slickensided plane reported as N217°E/62° with pitch 55° and a source-derived stress solution of σ1 19° toward N307°E, σ2 16° toward N043°E and σ3 65° toward N171°E. The original report calls the structure vertical dip-slip and right-slip; because the measured plane dips 62° and the lineation is oblique, the safest public wording is an oblique-slip fault with a reported dextral component until the original lineation notation and shear-sense criteria are rechecked. The outcrop pattern is mechanically plausible: stronger sandstone beds preserve markers and fracture, whereas clay-rich layers weather back and can accommodate distributed strain or bedding-parallel slip. That contrast can make damage appear wider in one bed than the next. The montage is comparative, not a continuous transect, and it does not establish displacement magnitude or one unbroken fault core. Field-37 has been corrected accordingly: it is steeply inclined Halang interbedding, not tectonic breccia. A final kinematic model needs station-linked plane and lineation data, offset markers, fracture intensity, damage-zone width and map-scale continuity.
ROCK OUTCROP · FLAGSHIP DISPLAY
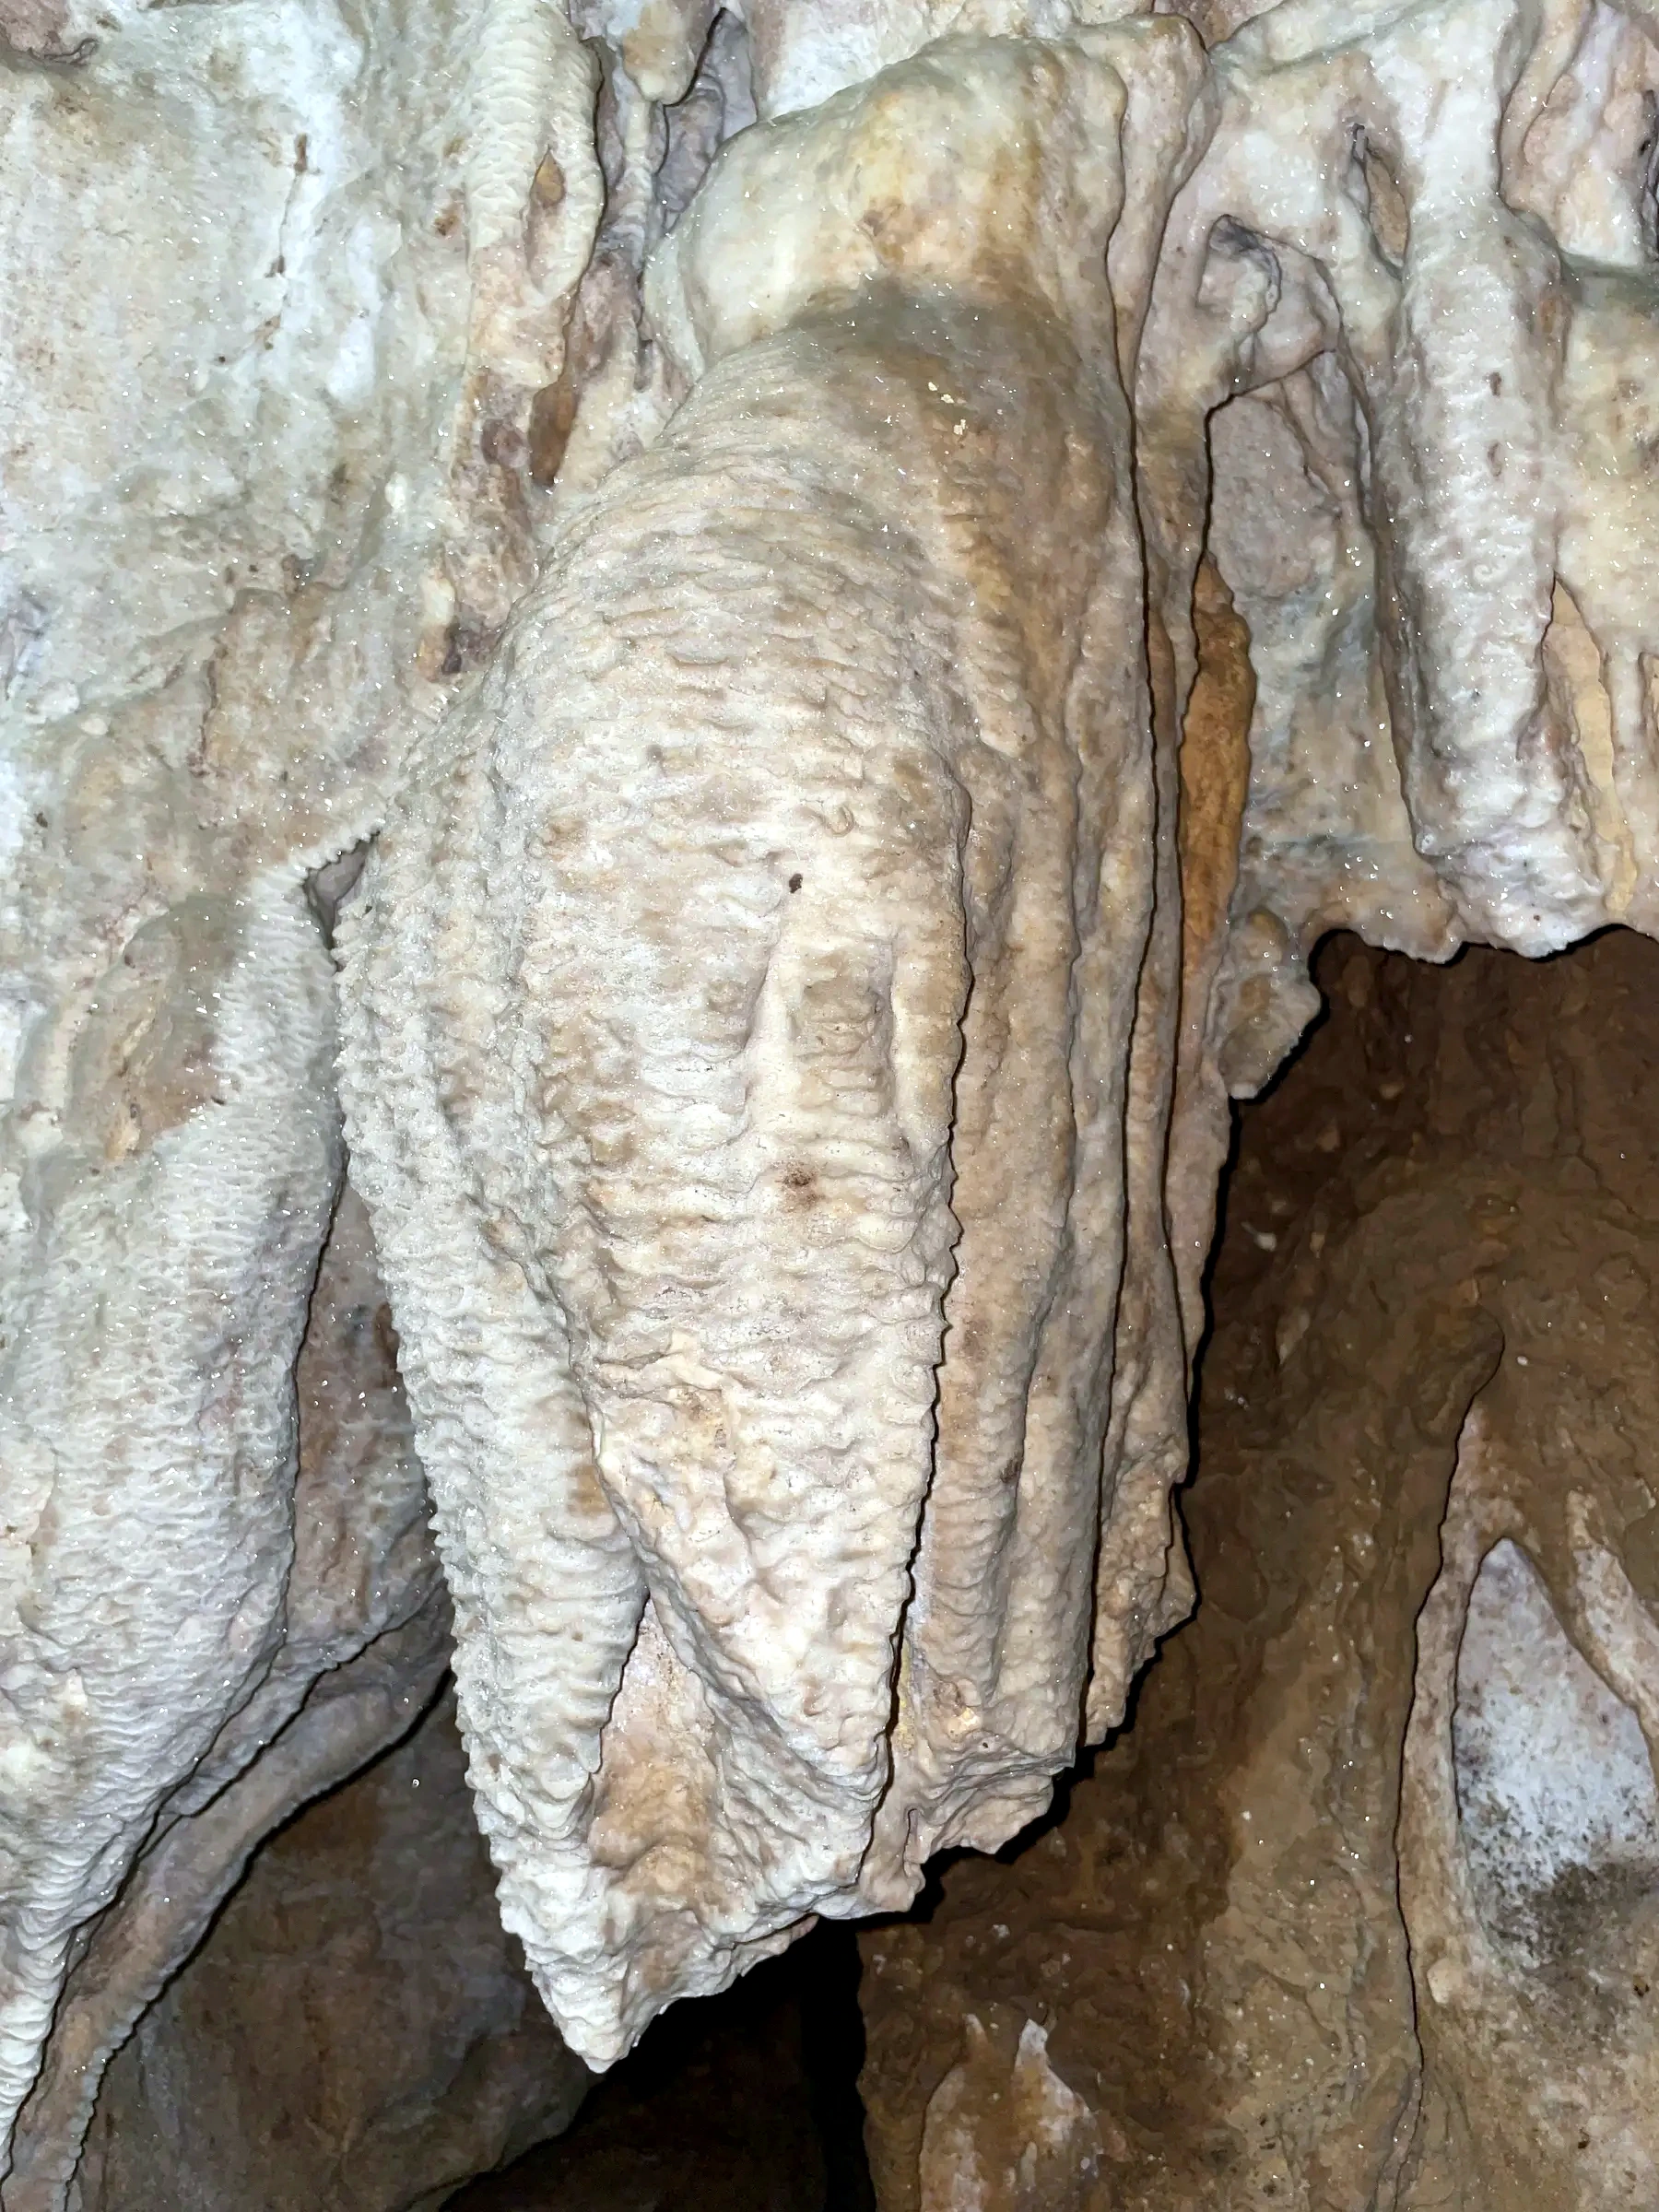
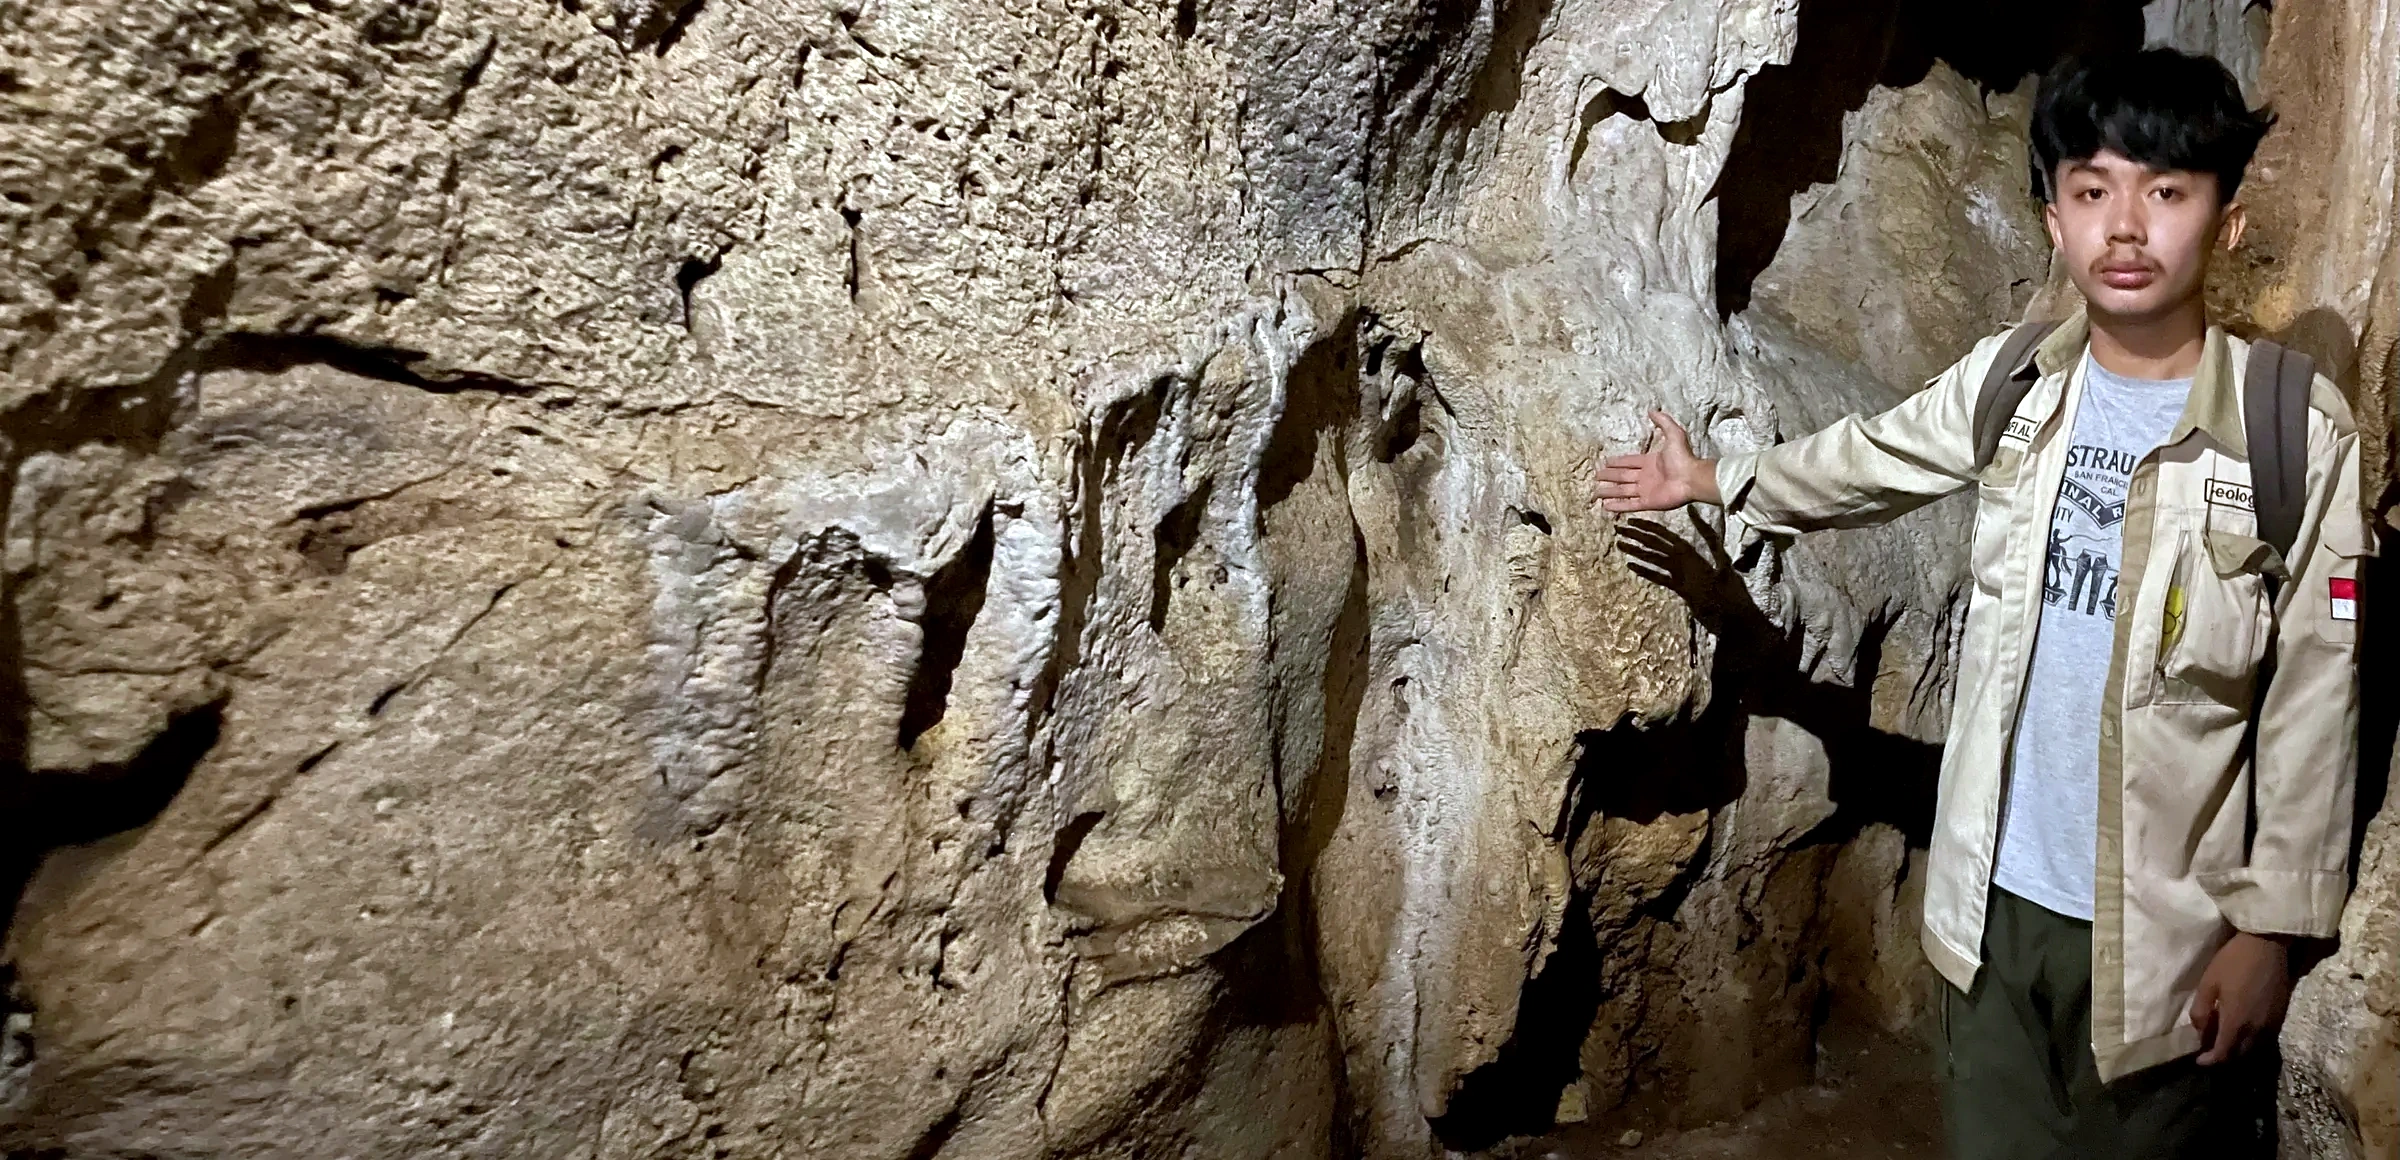
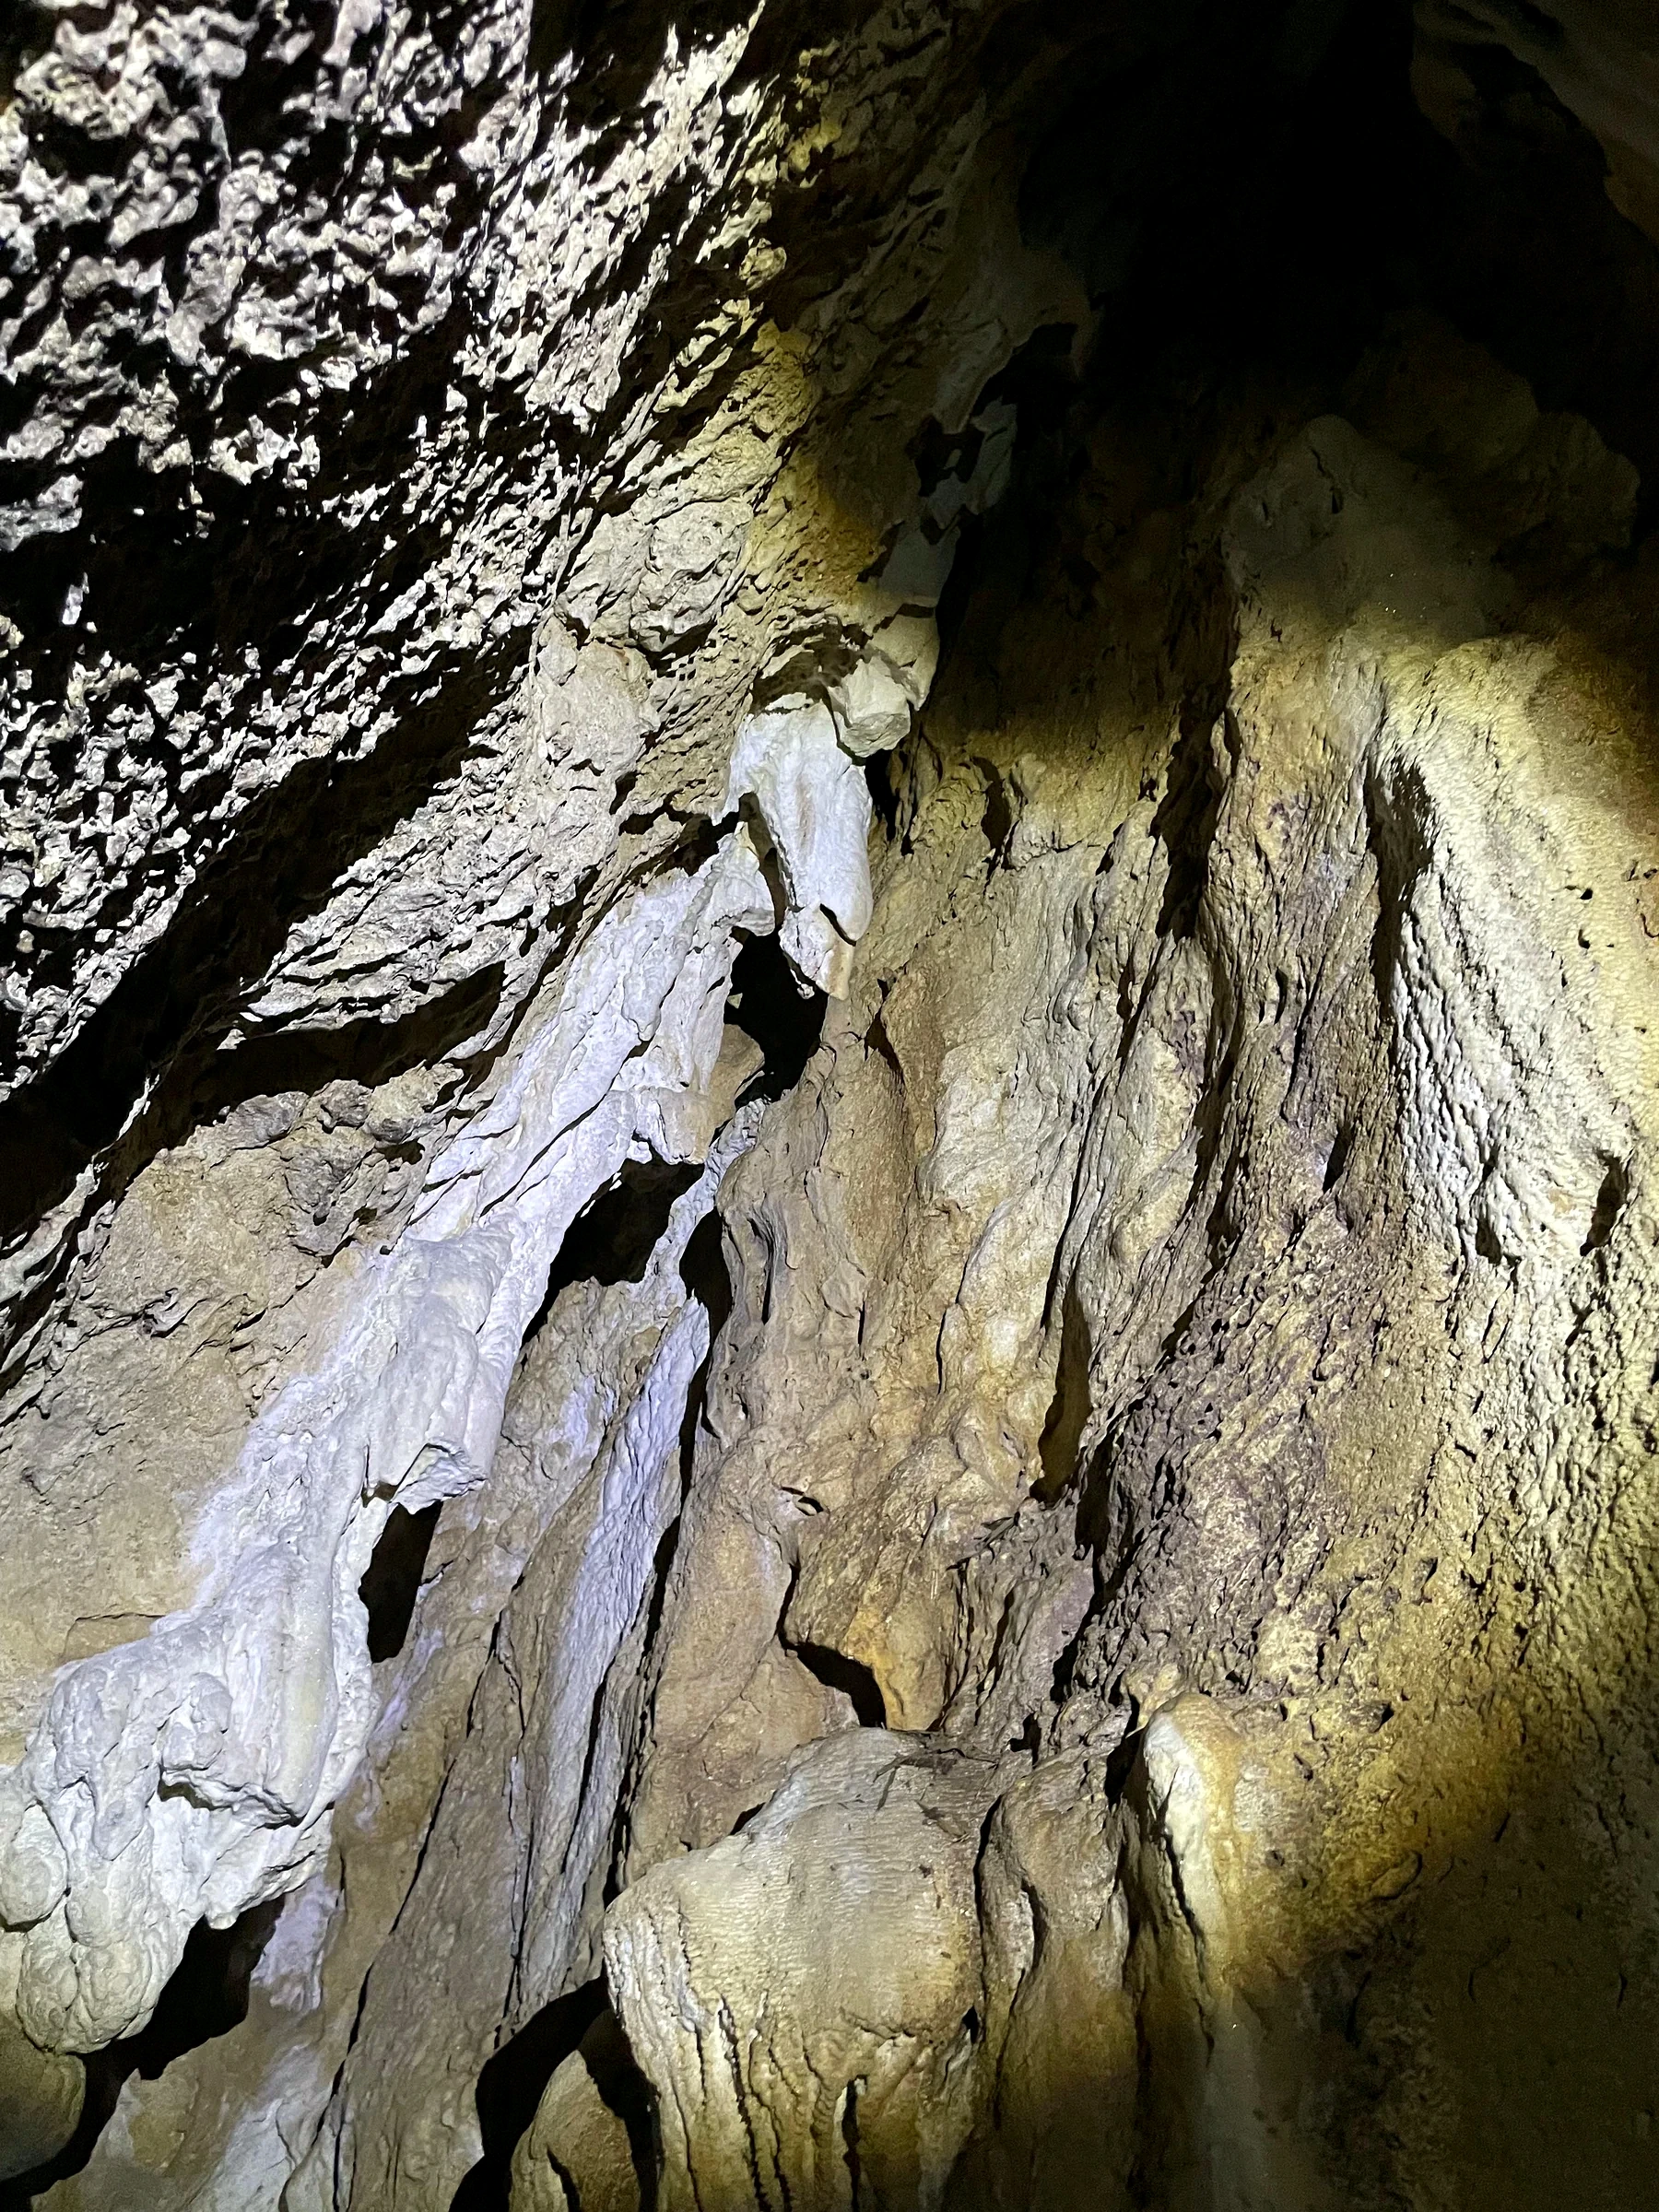
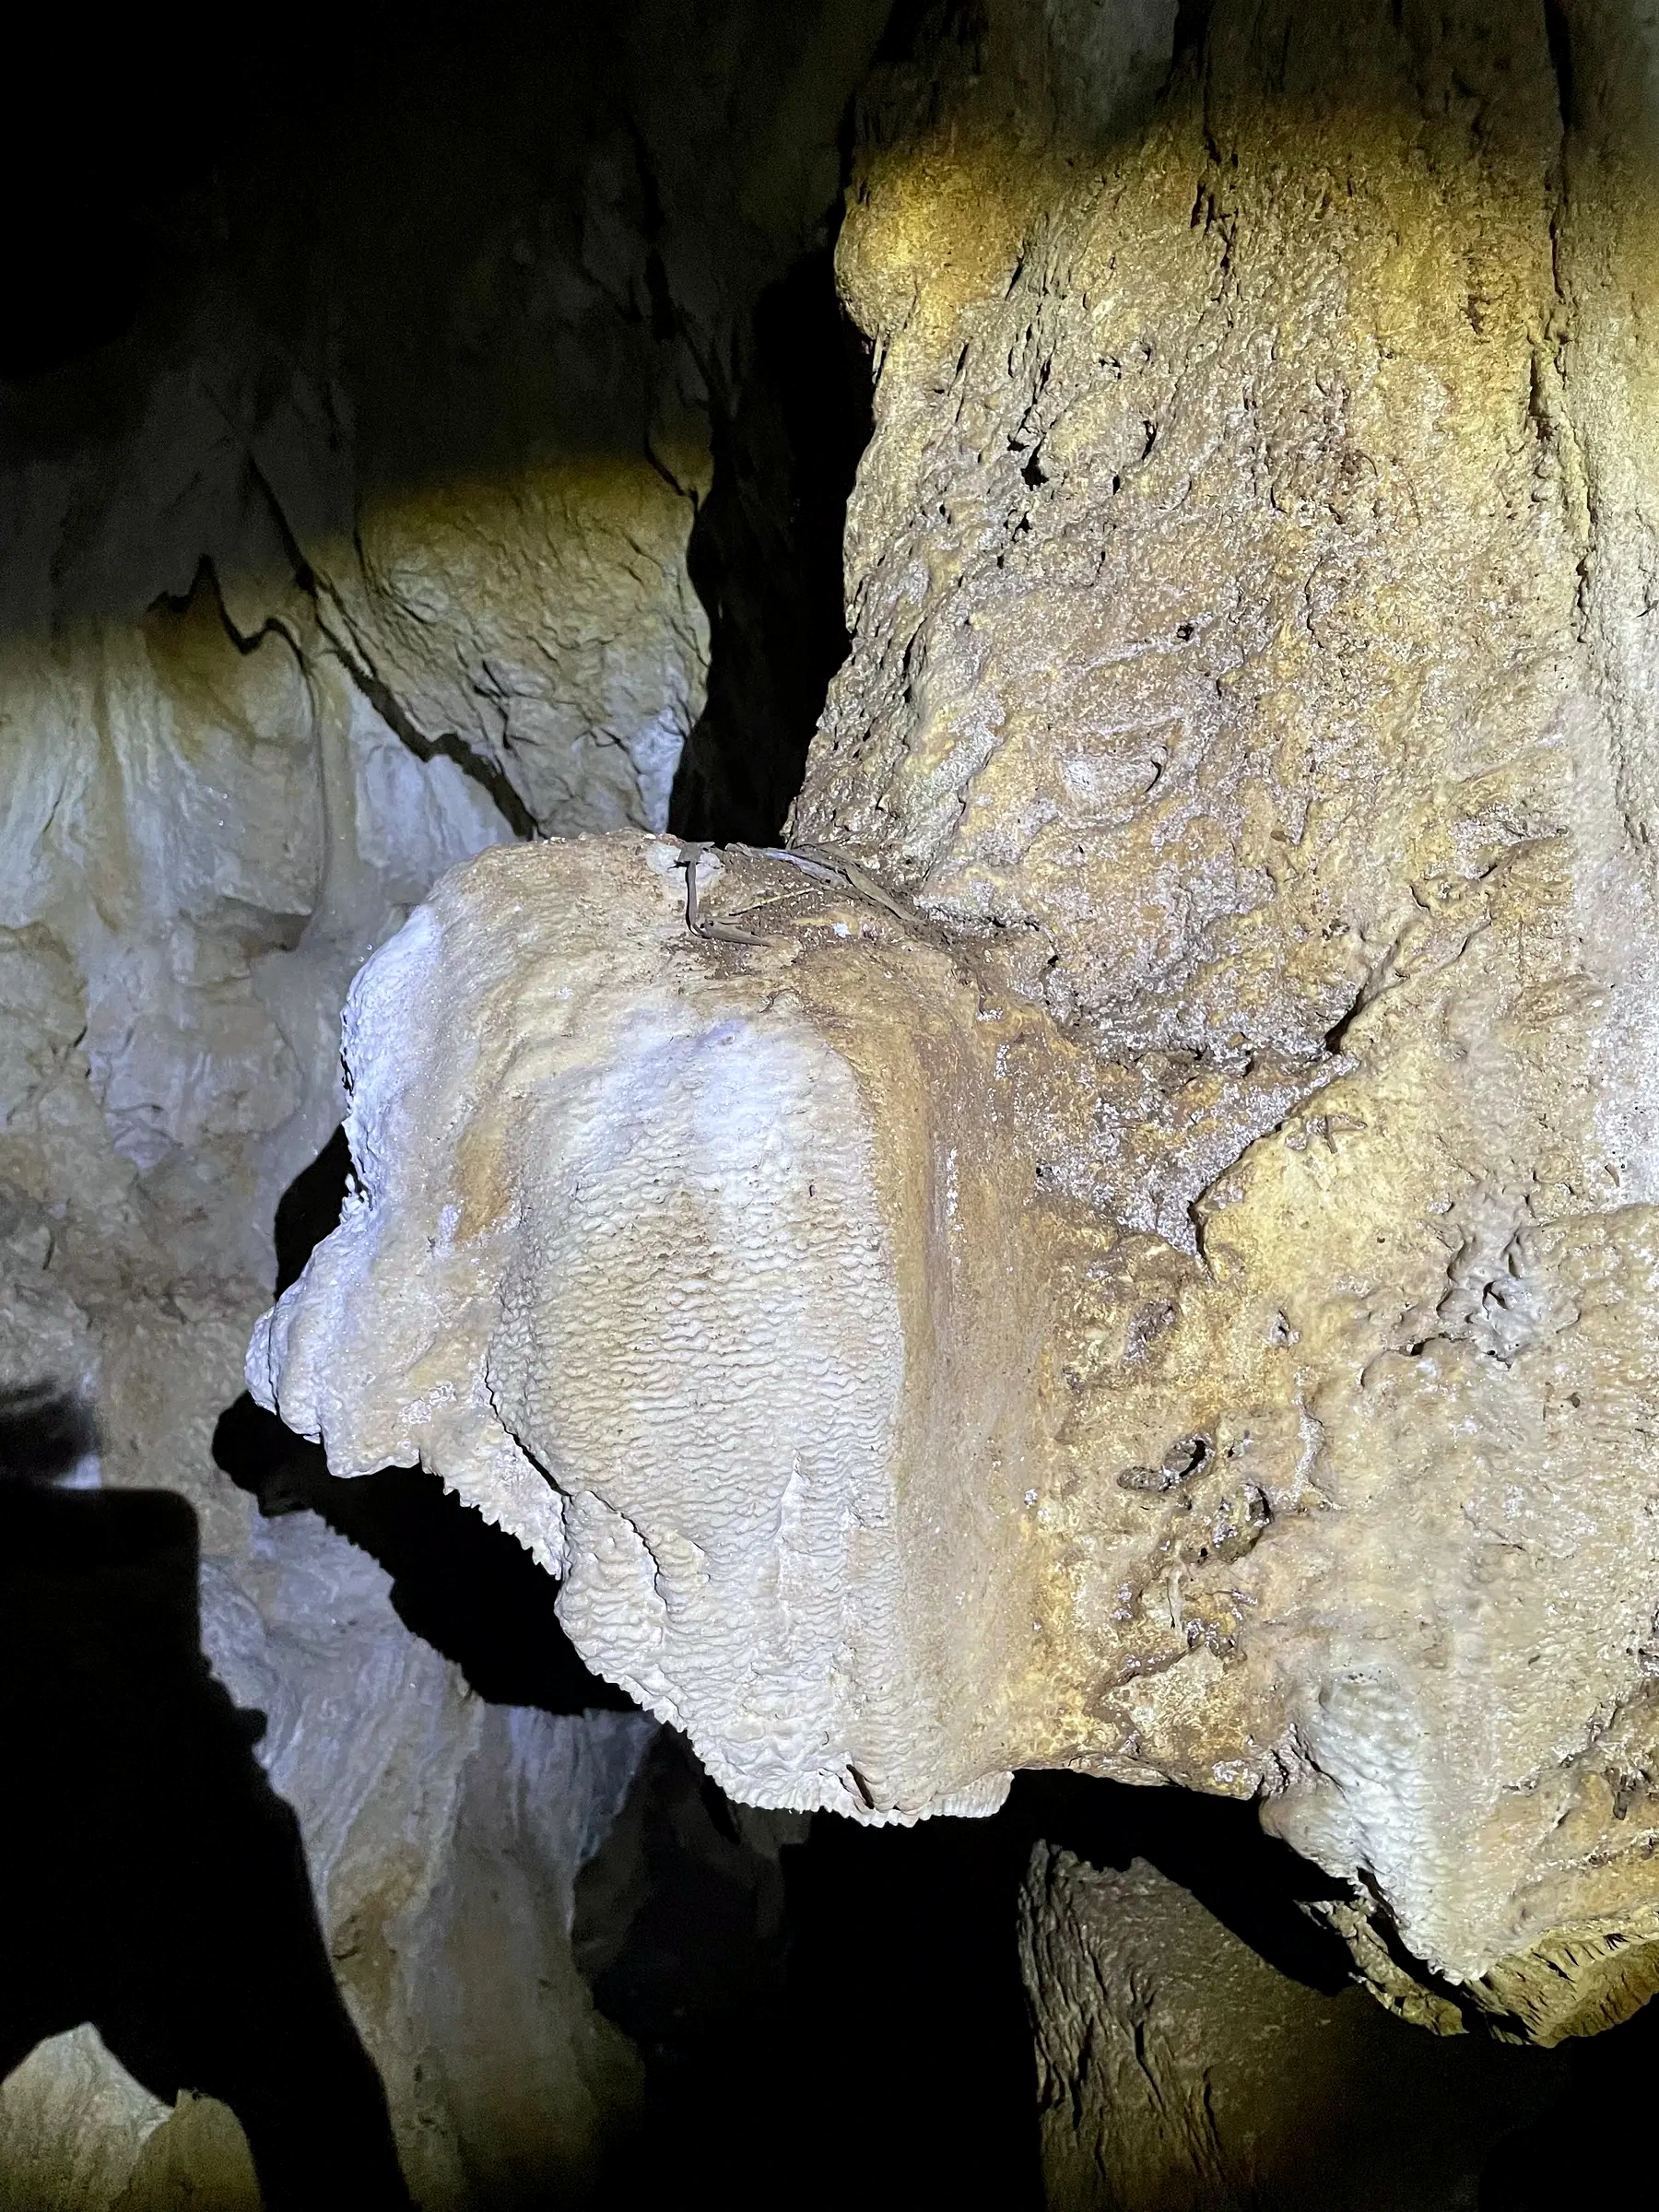
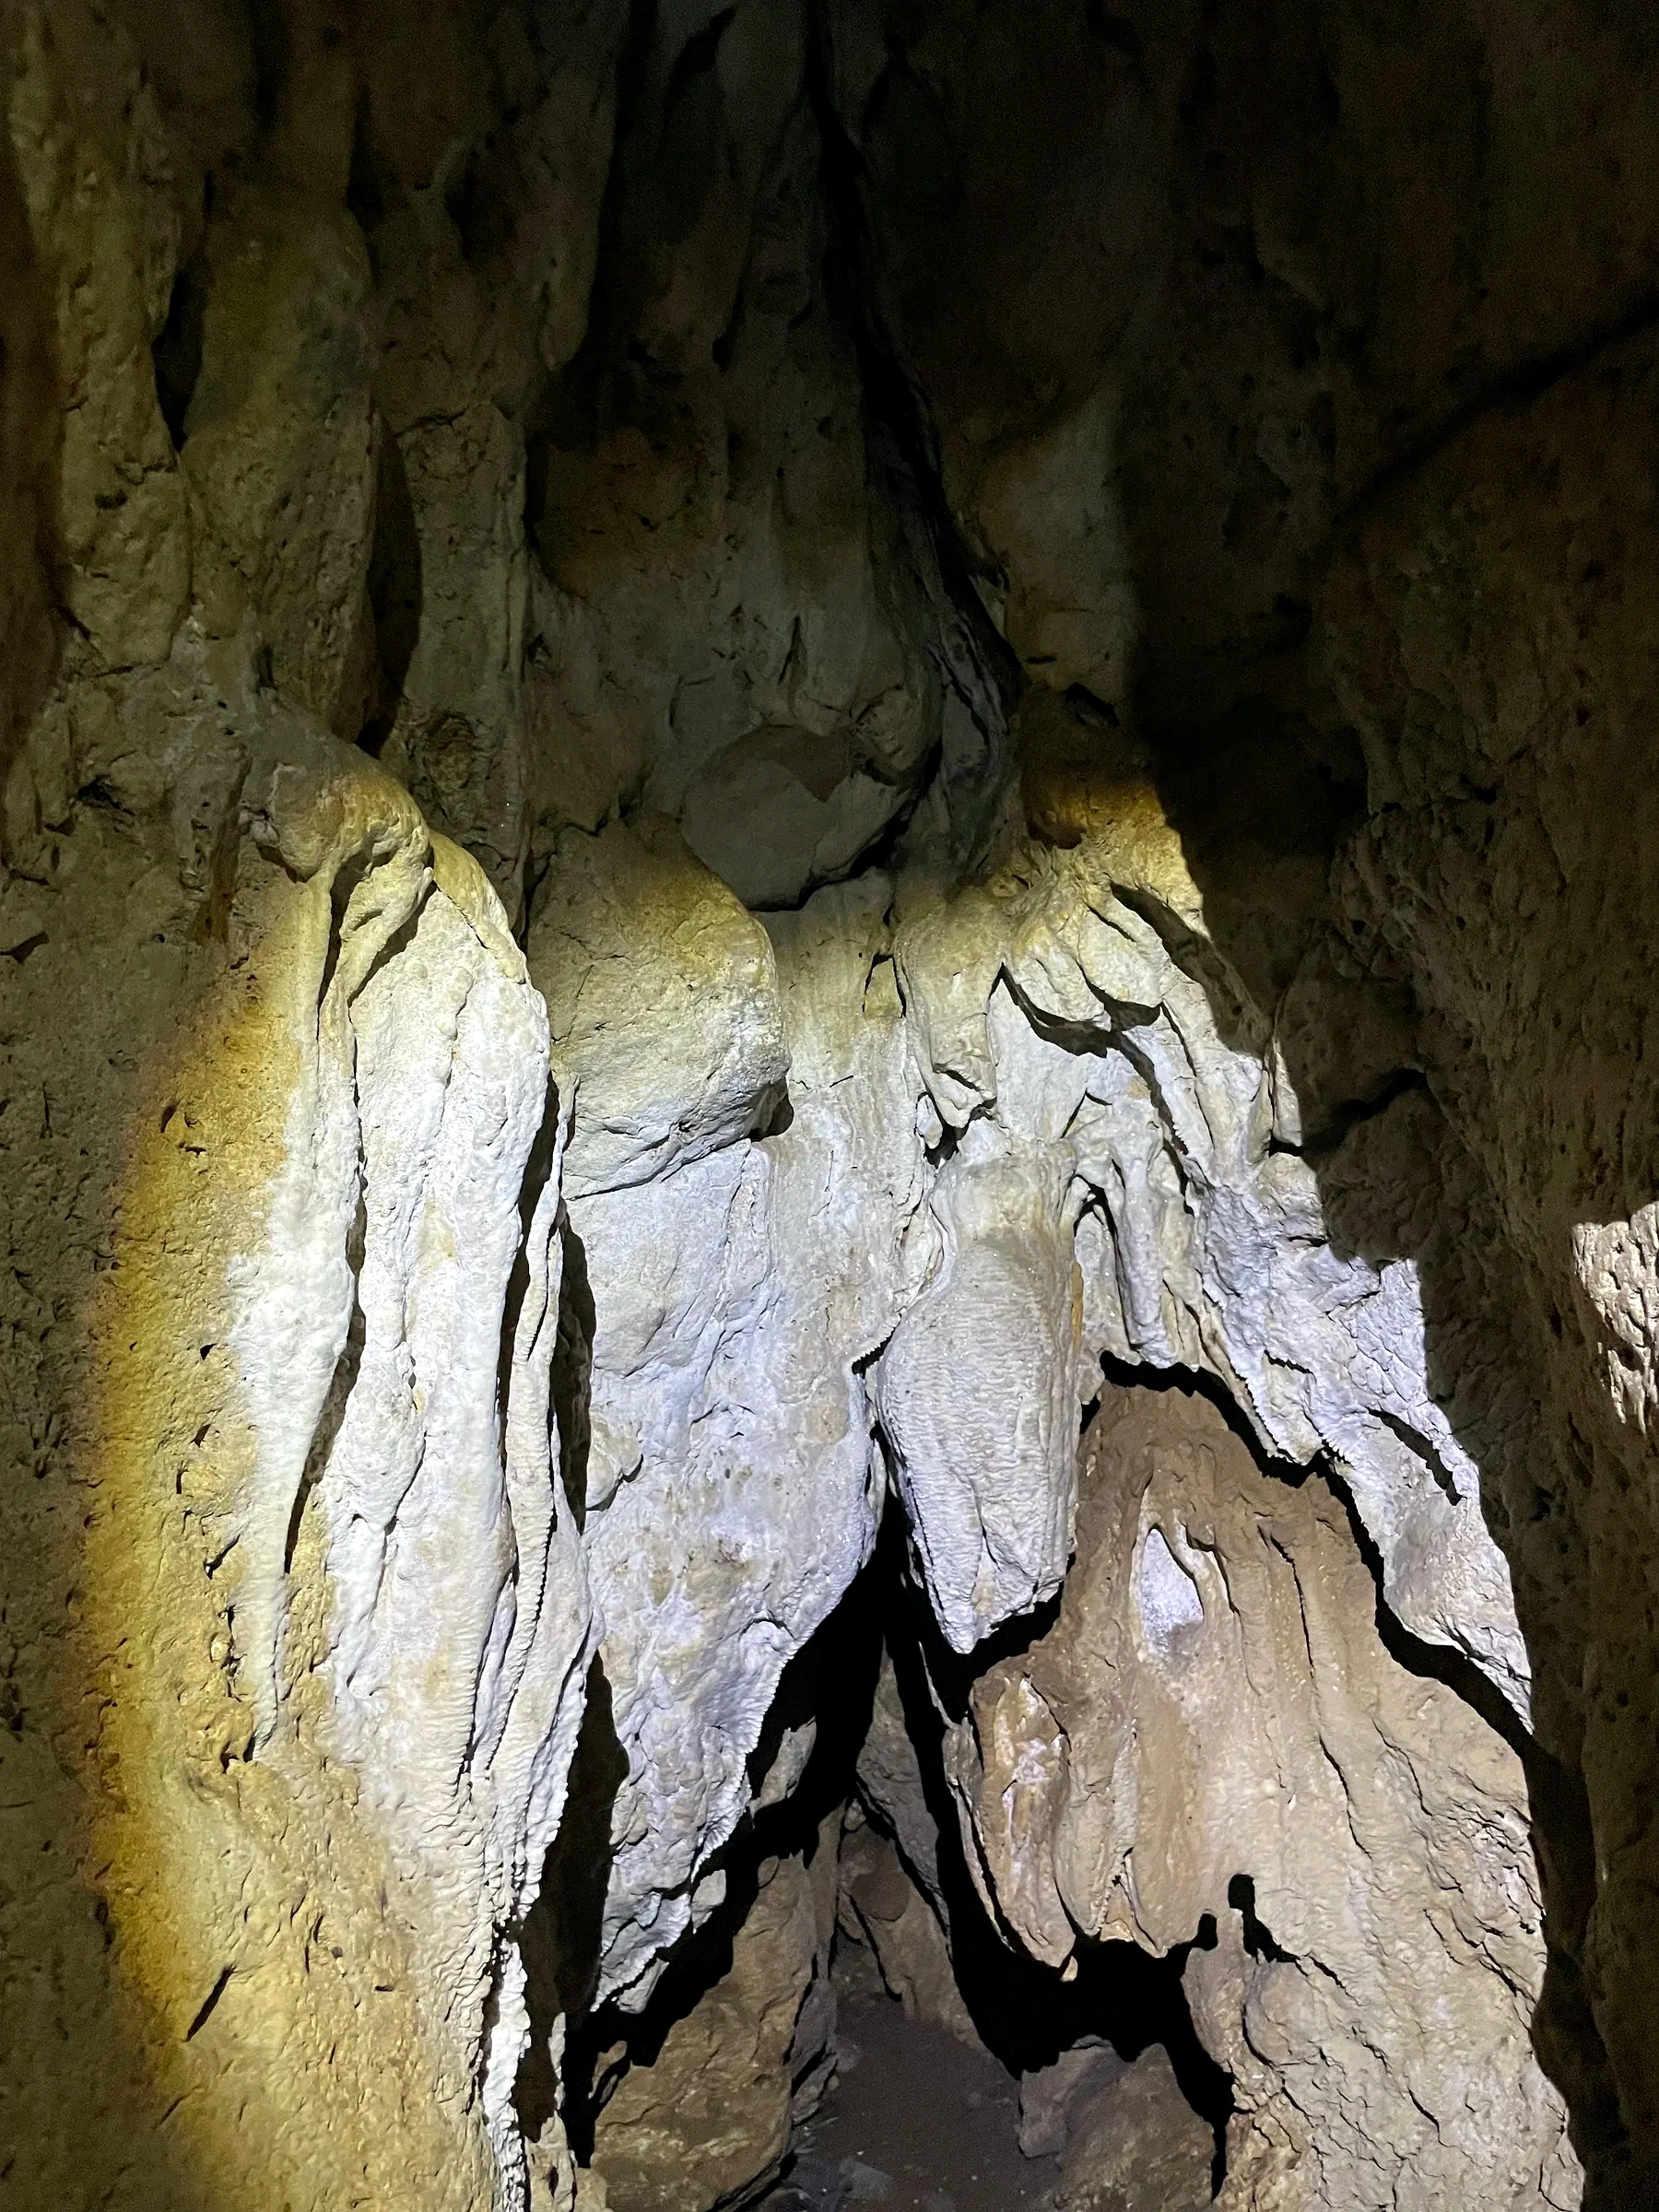
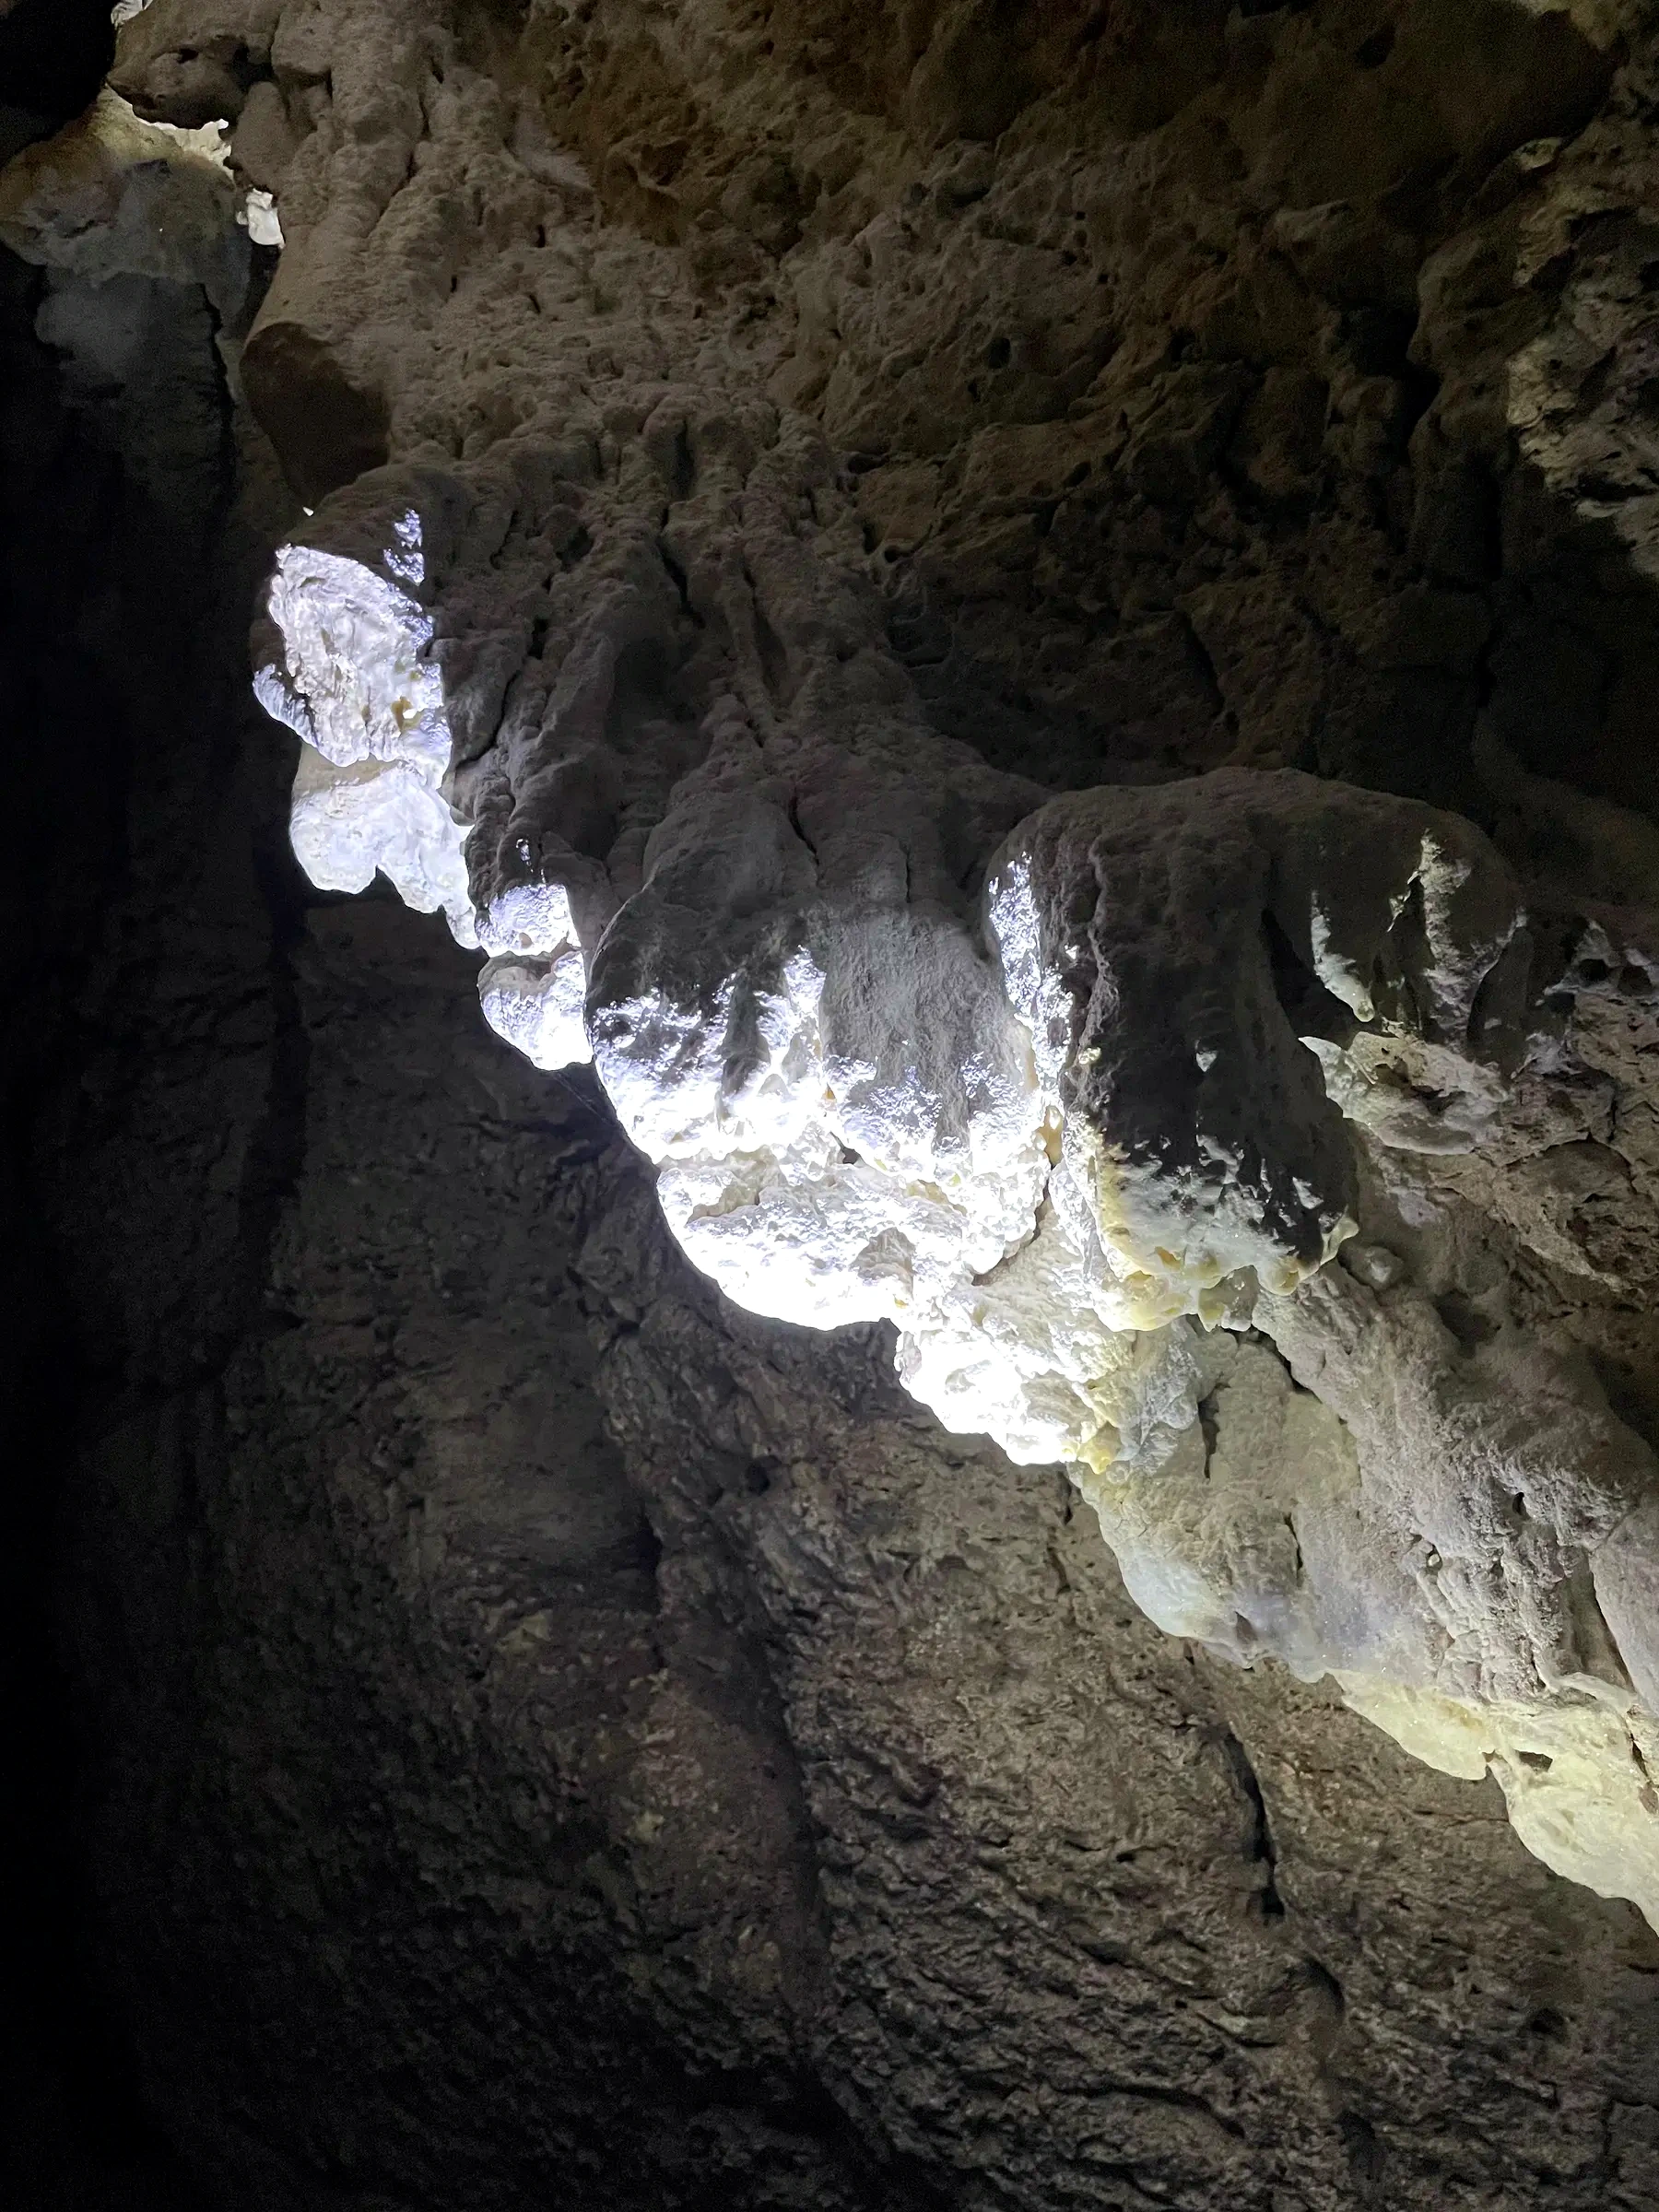
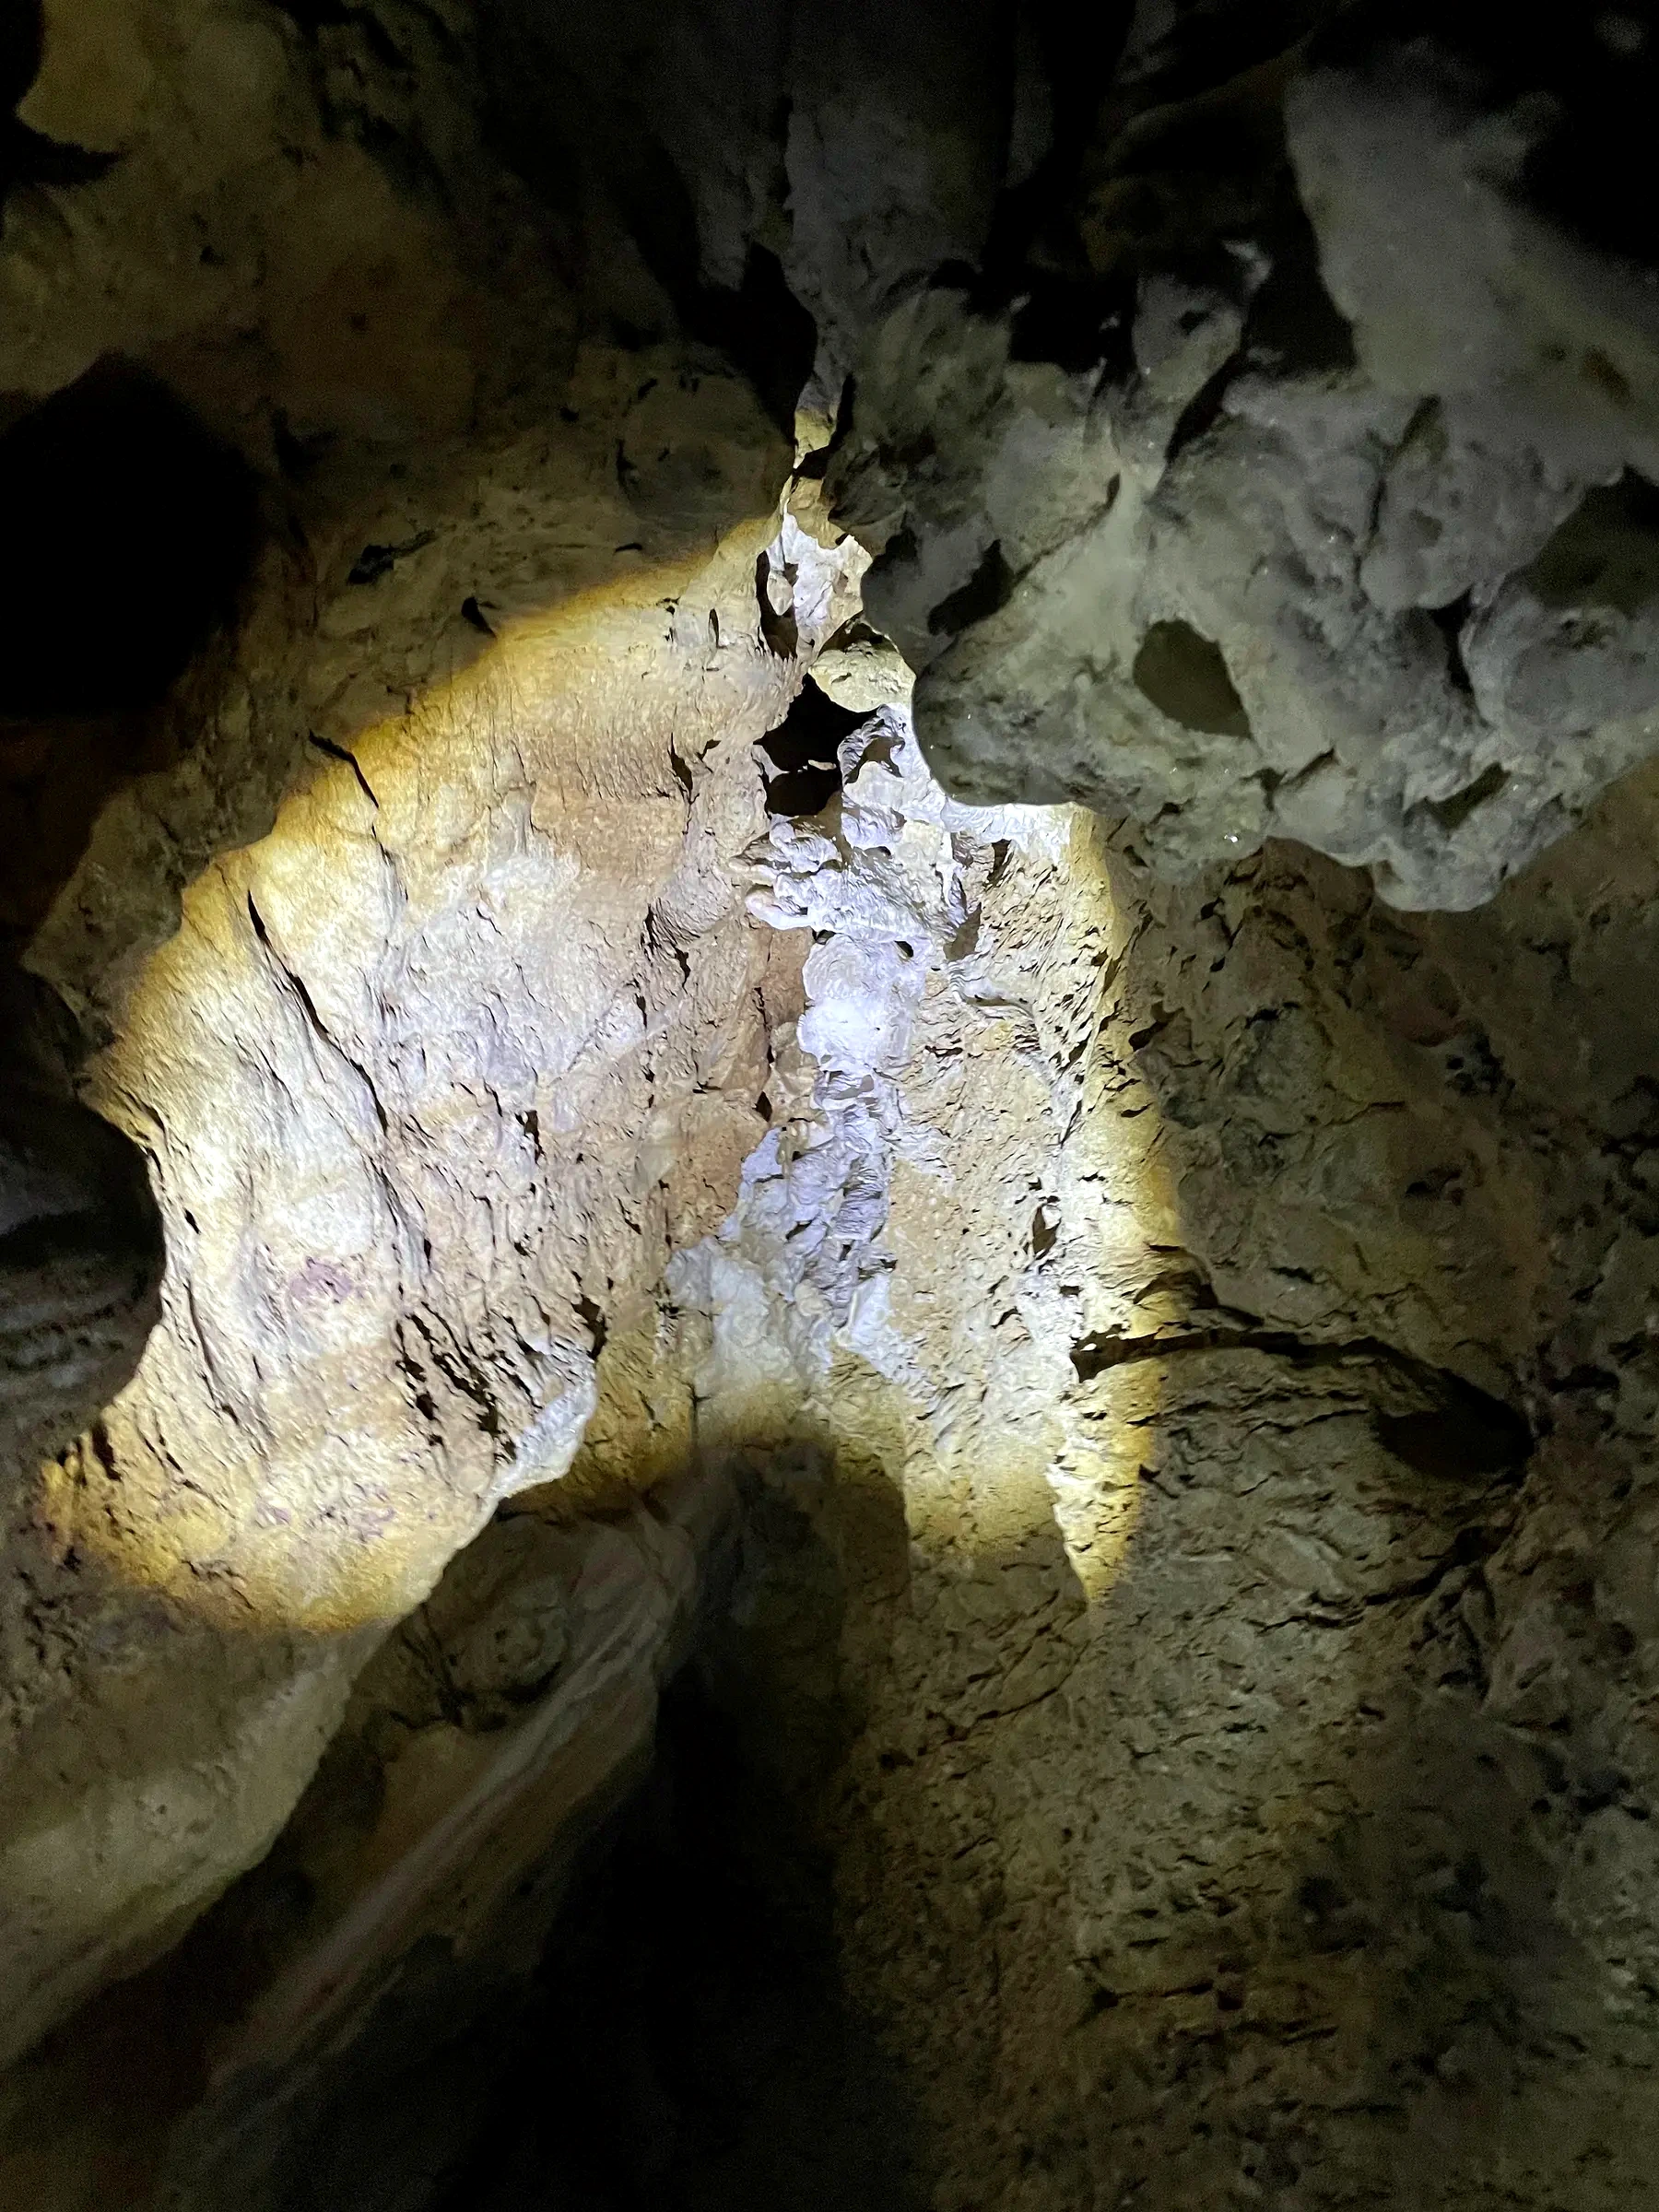
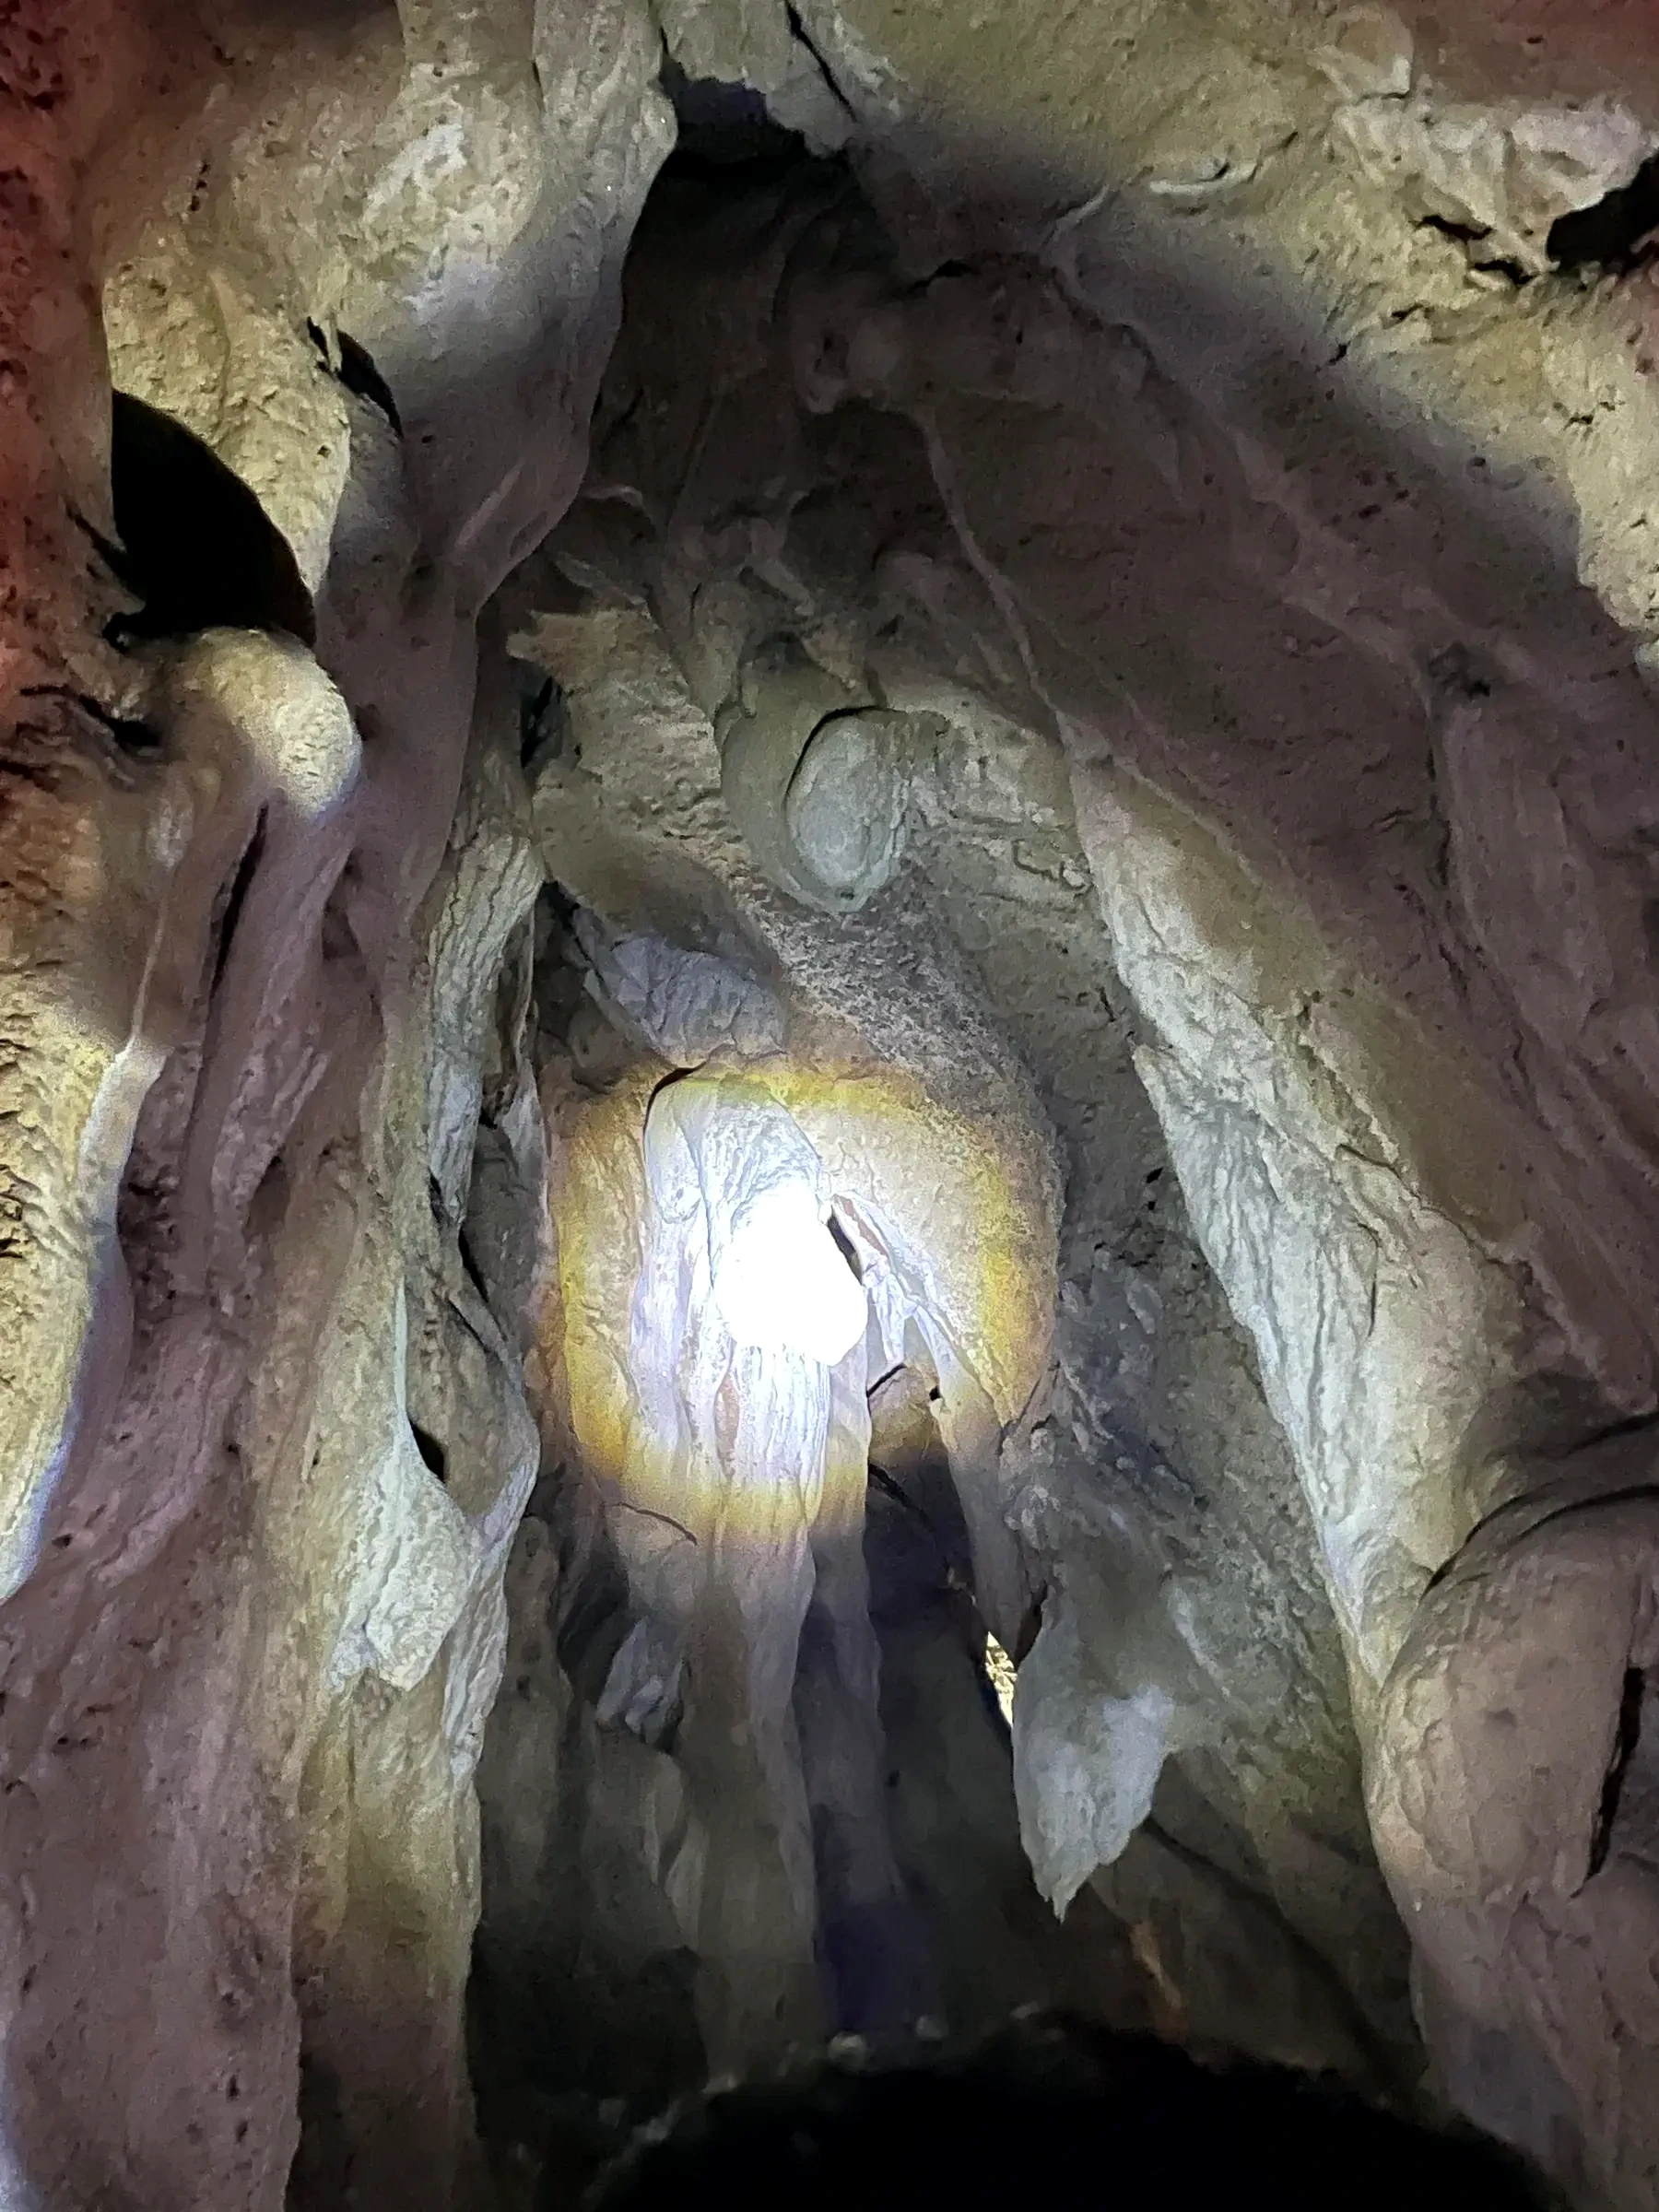
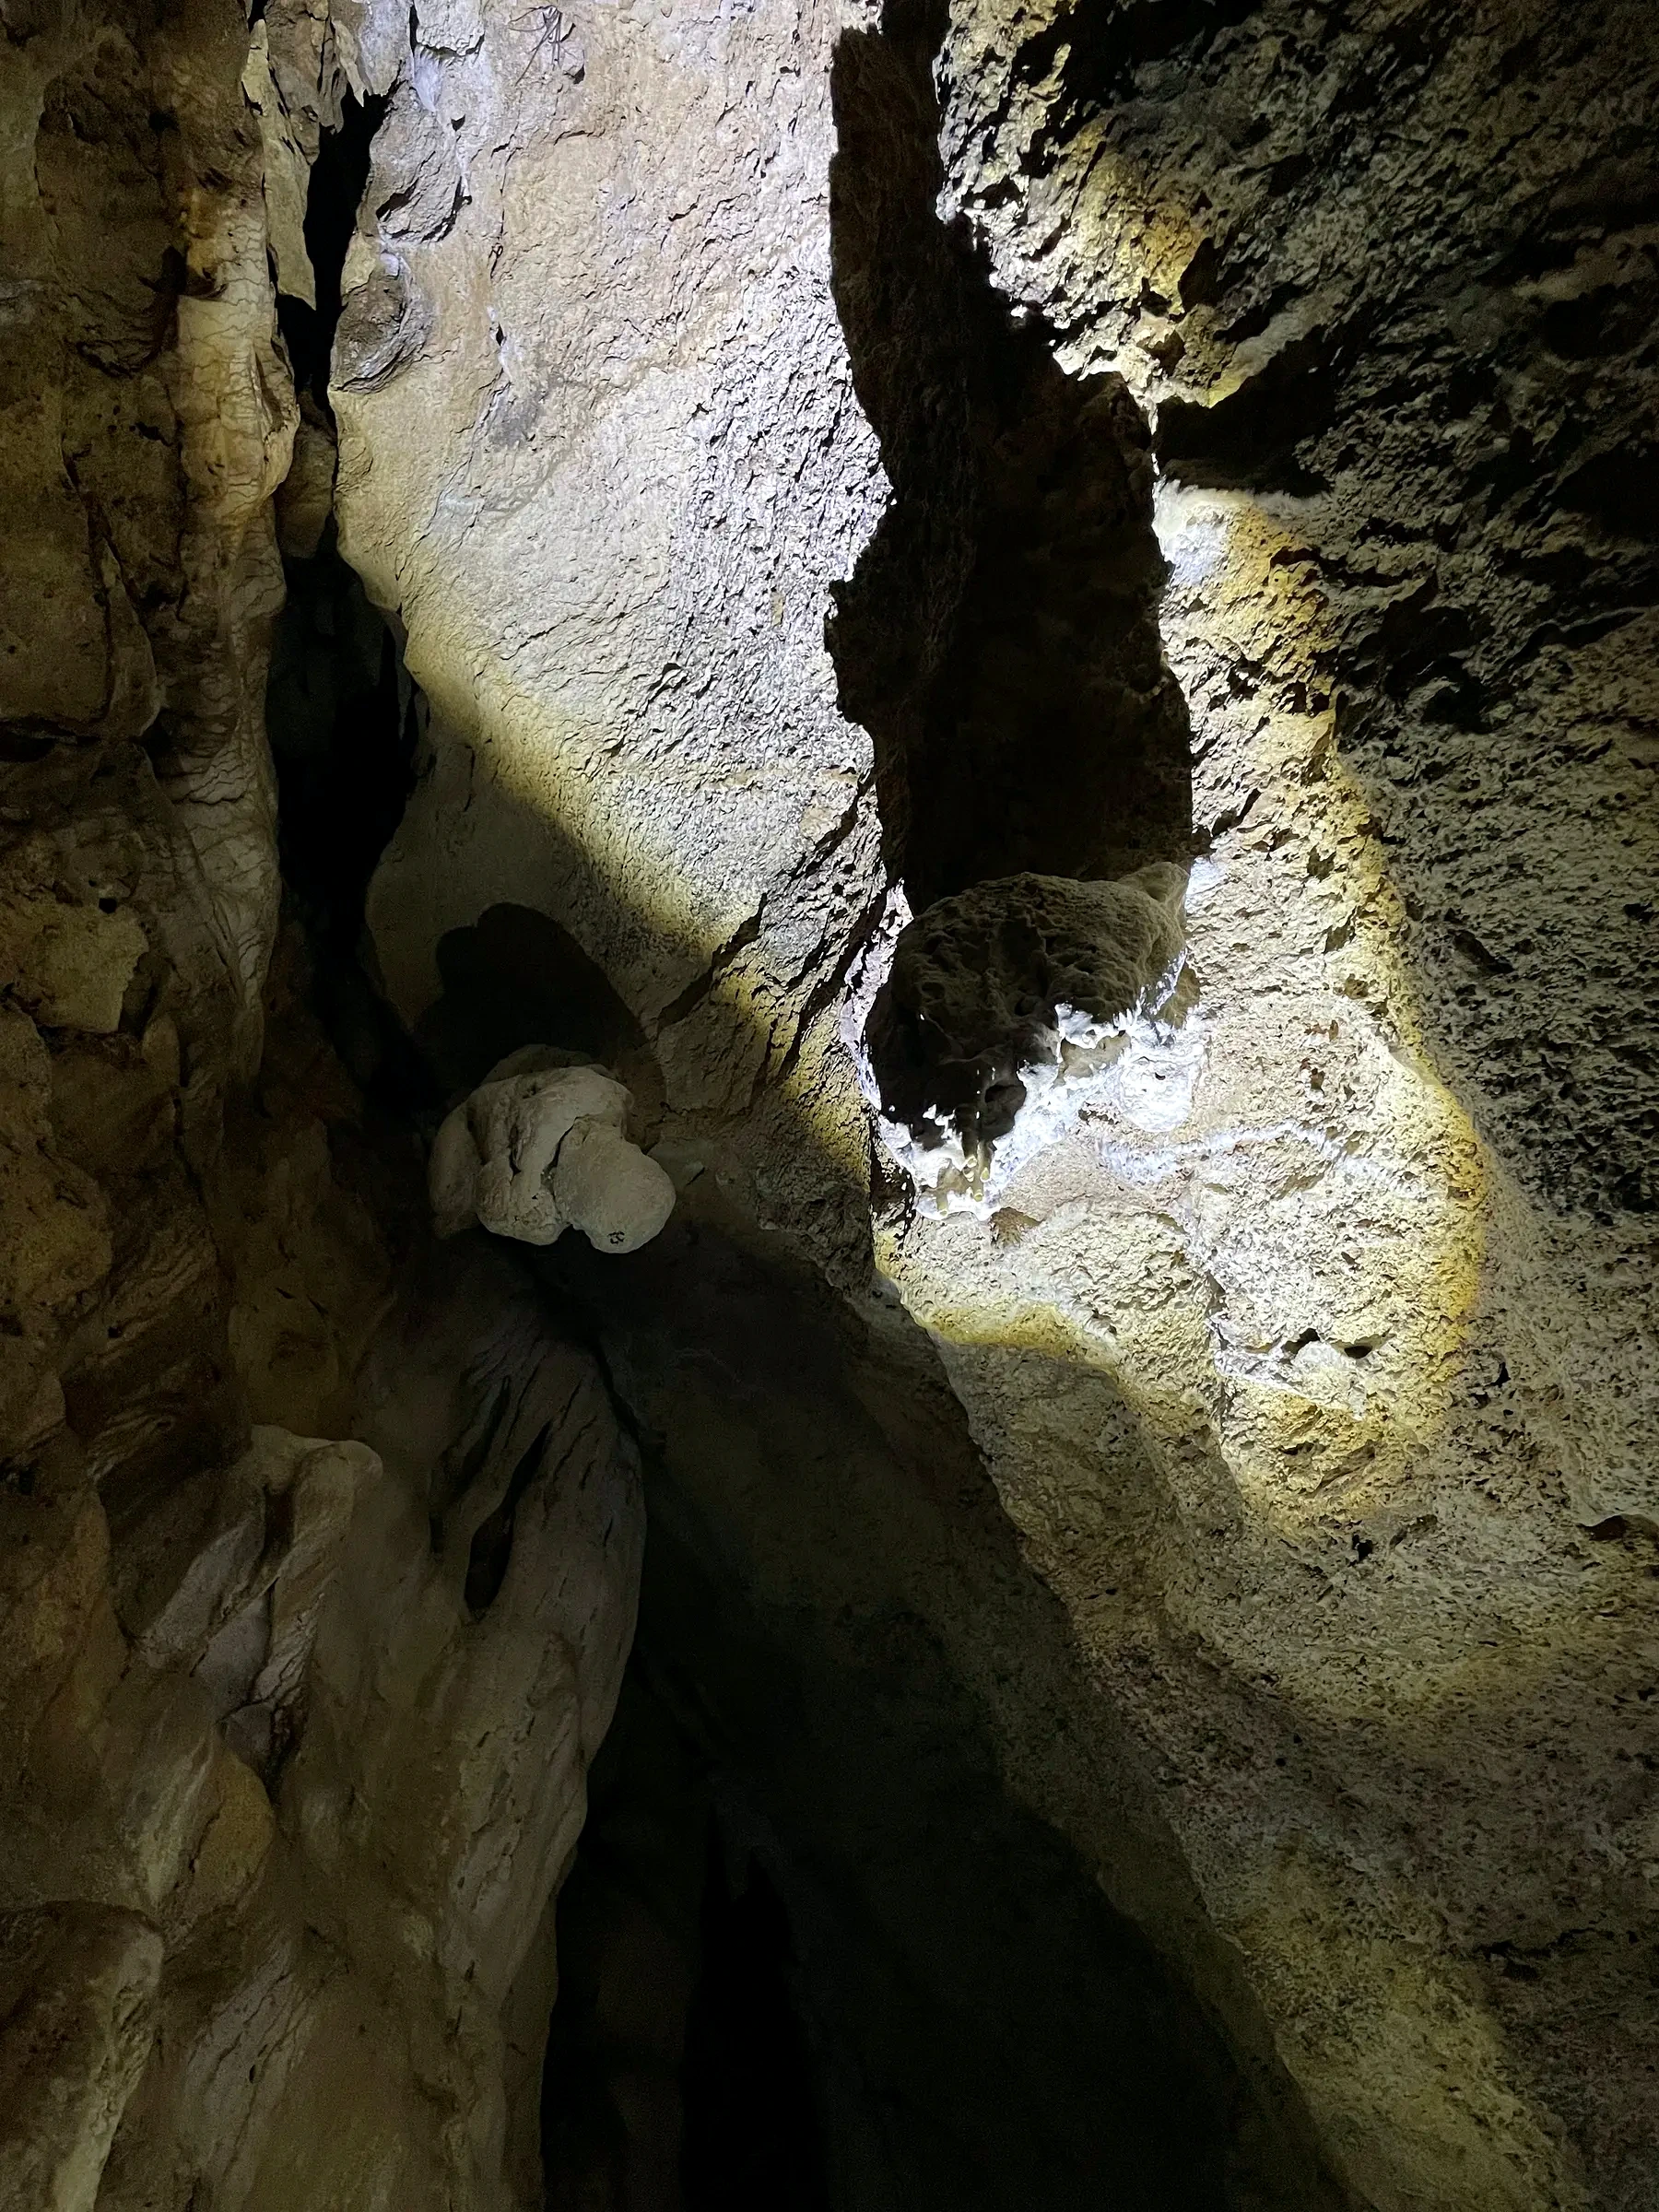
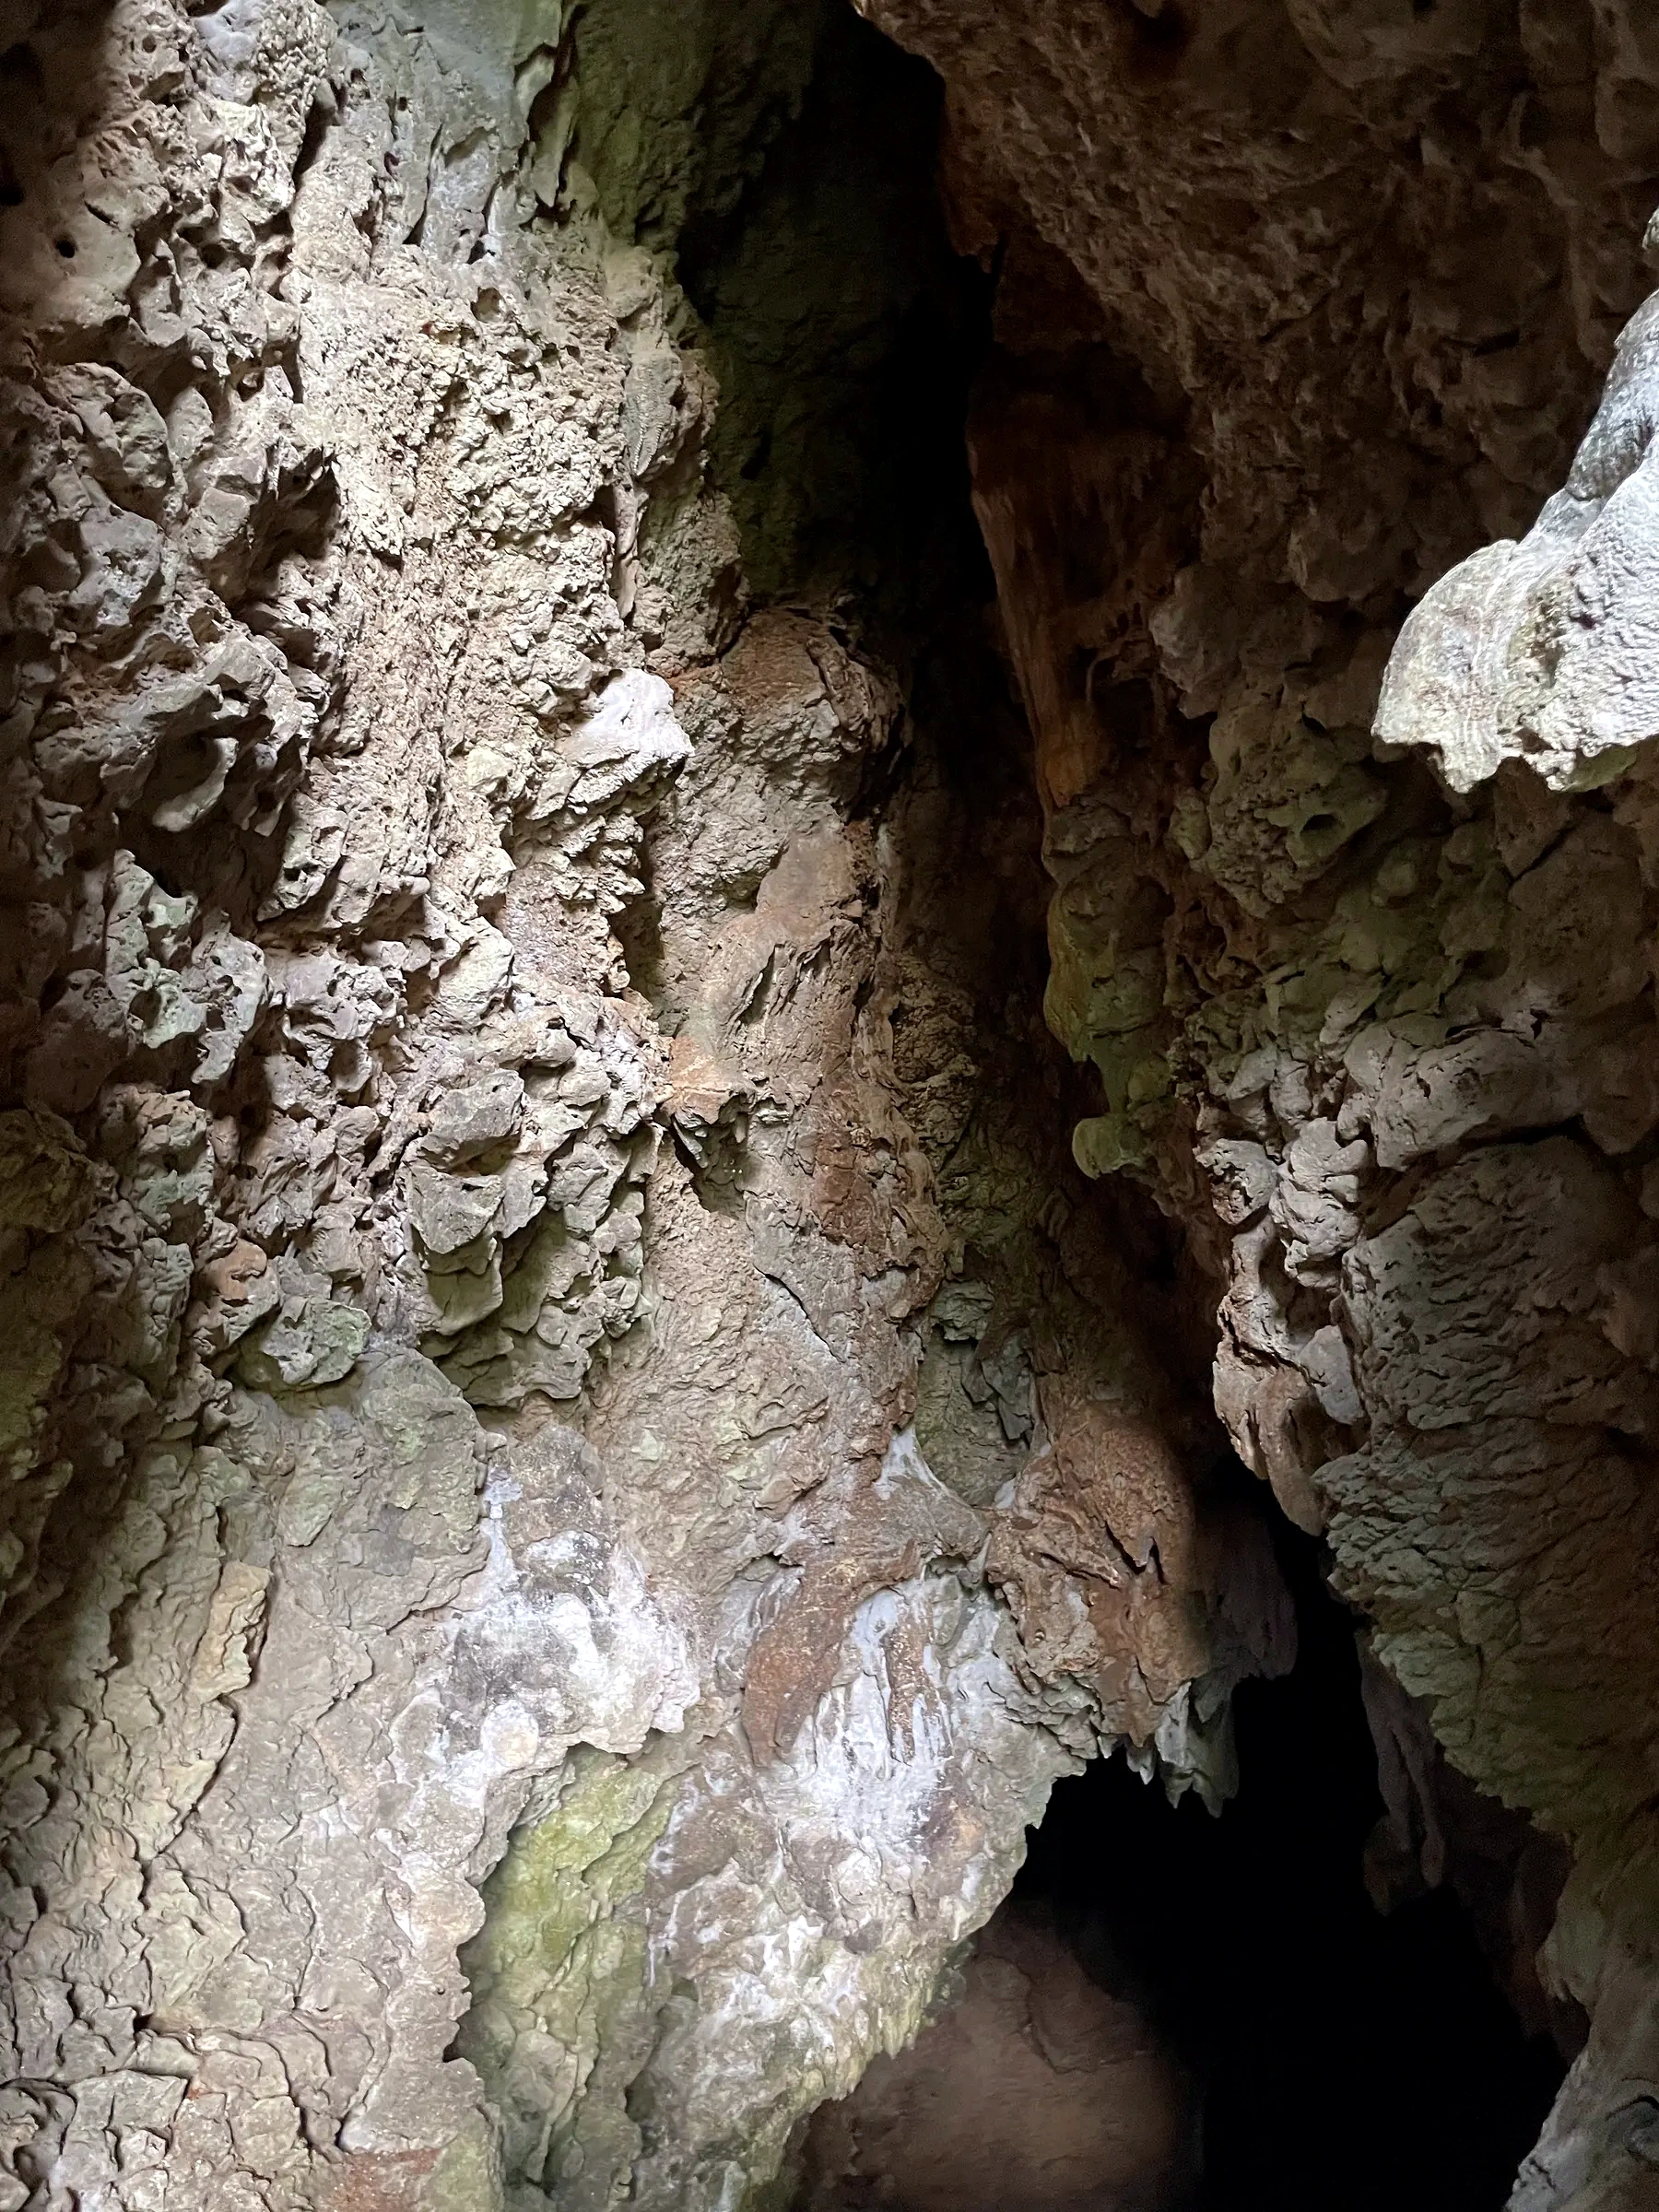
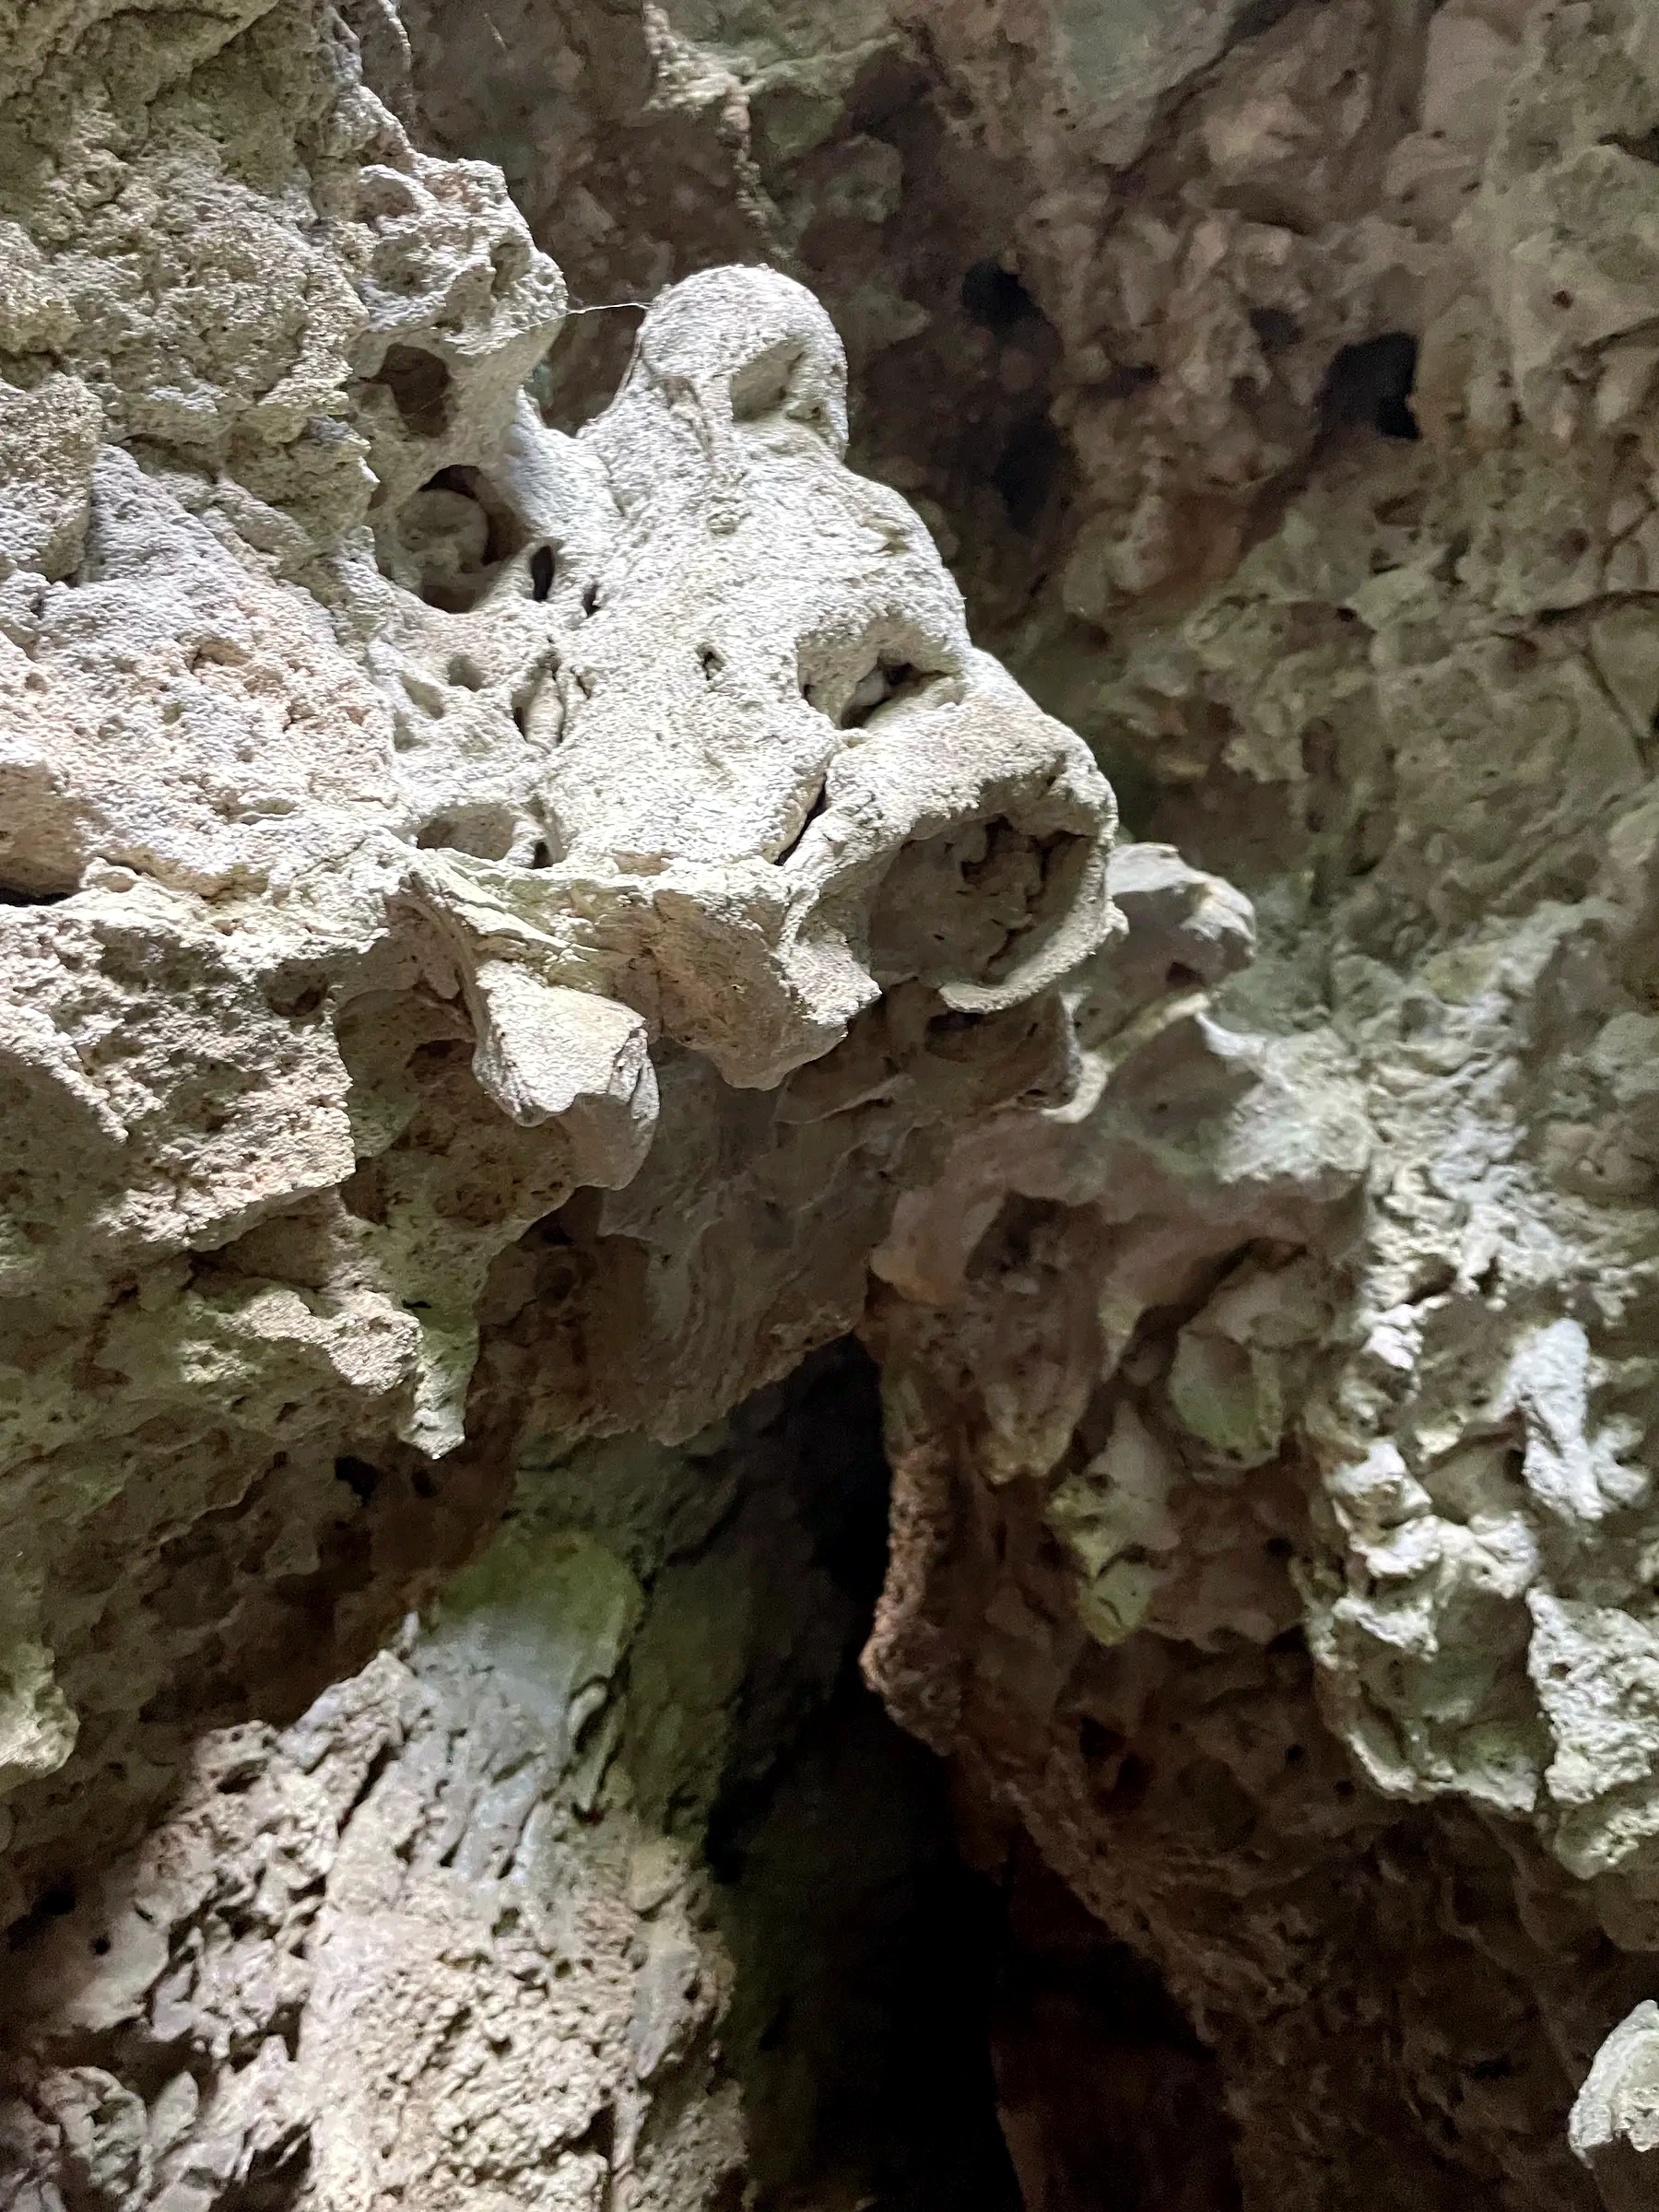
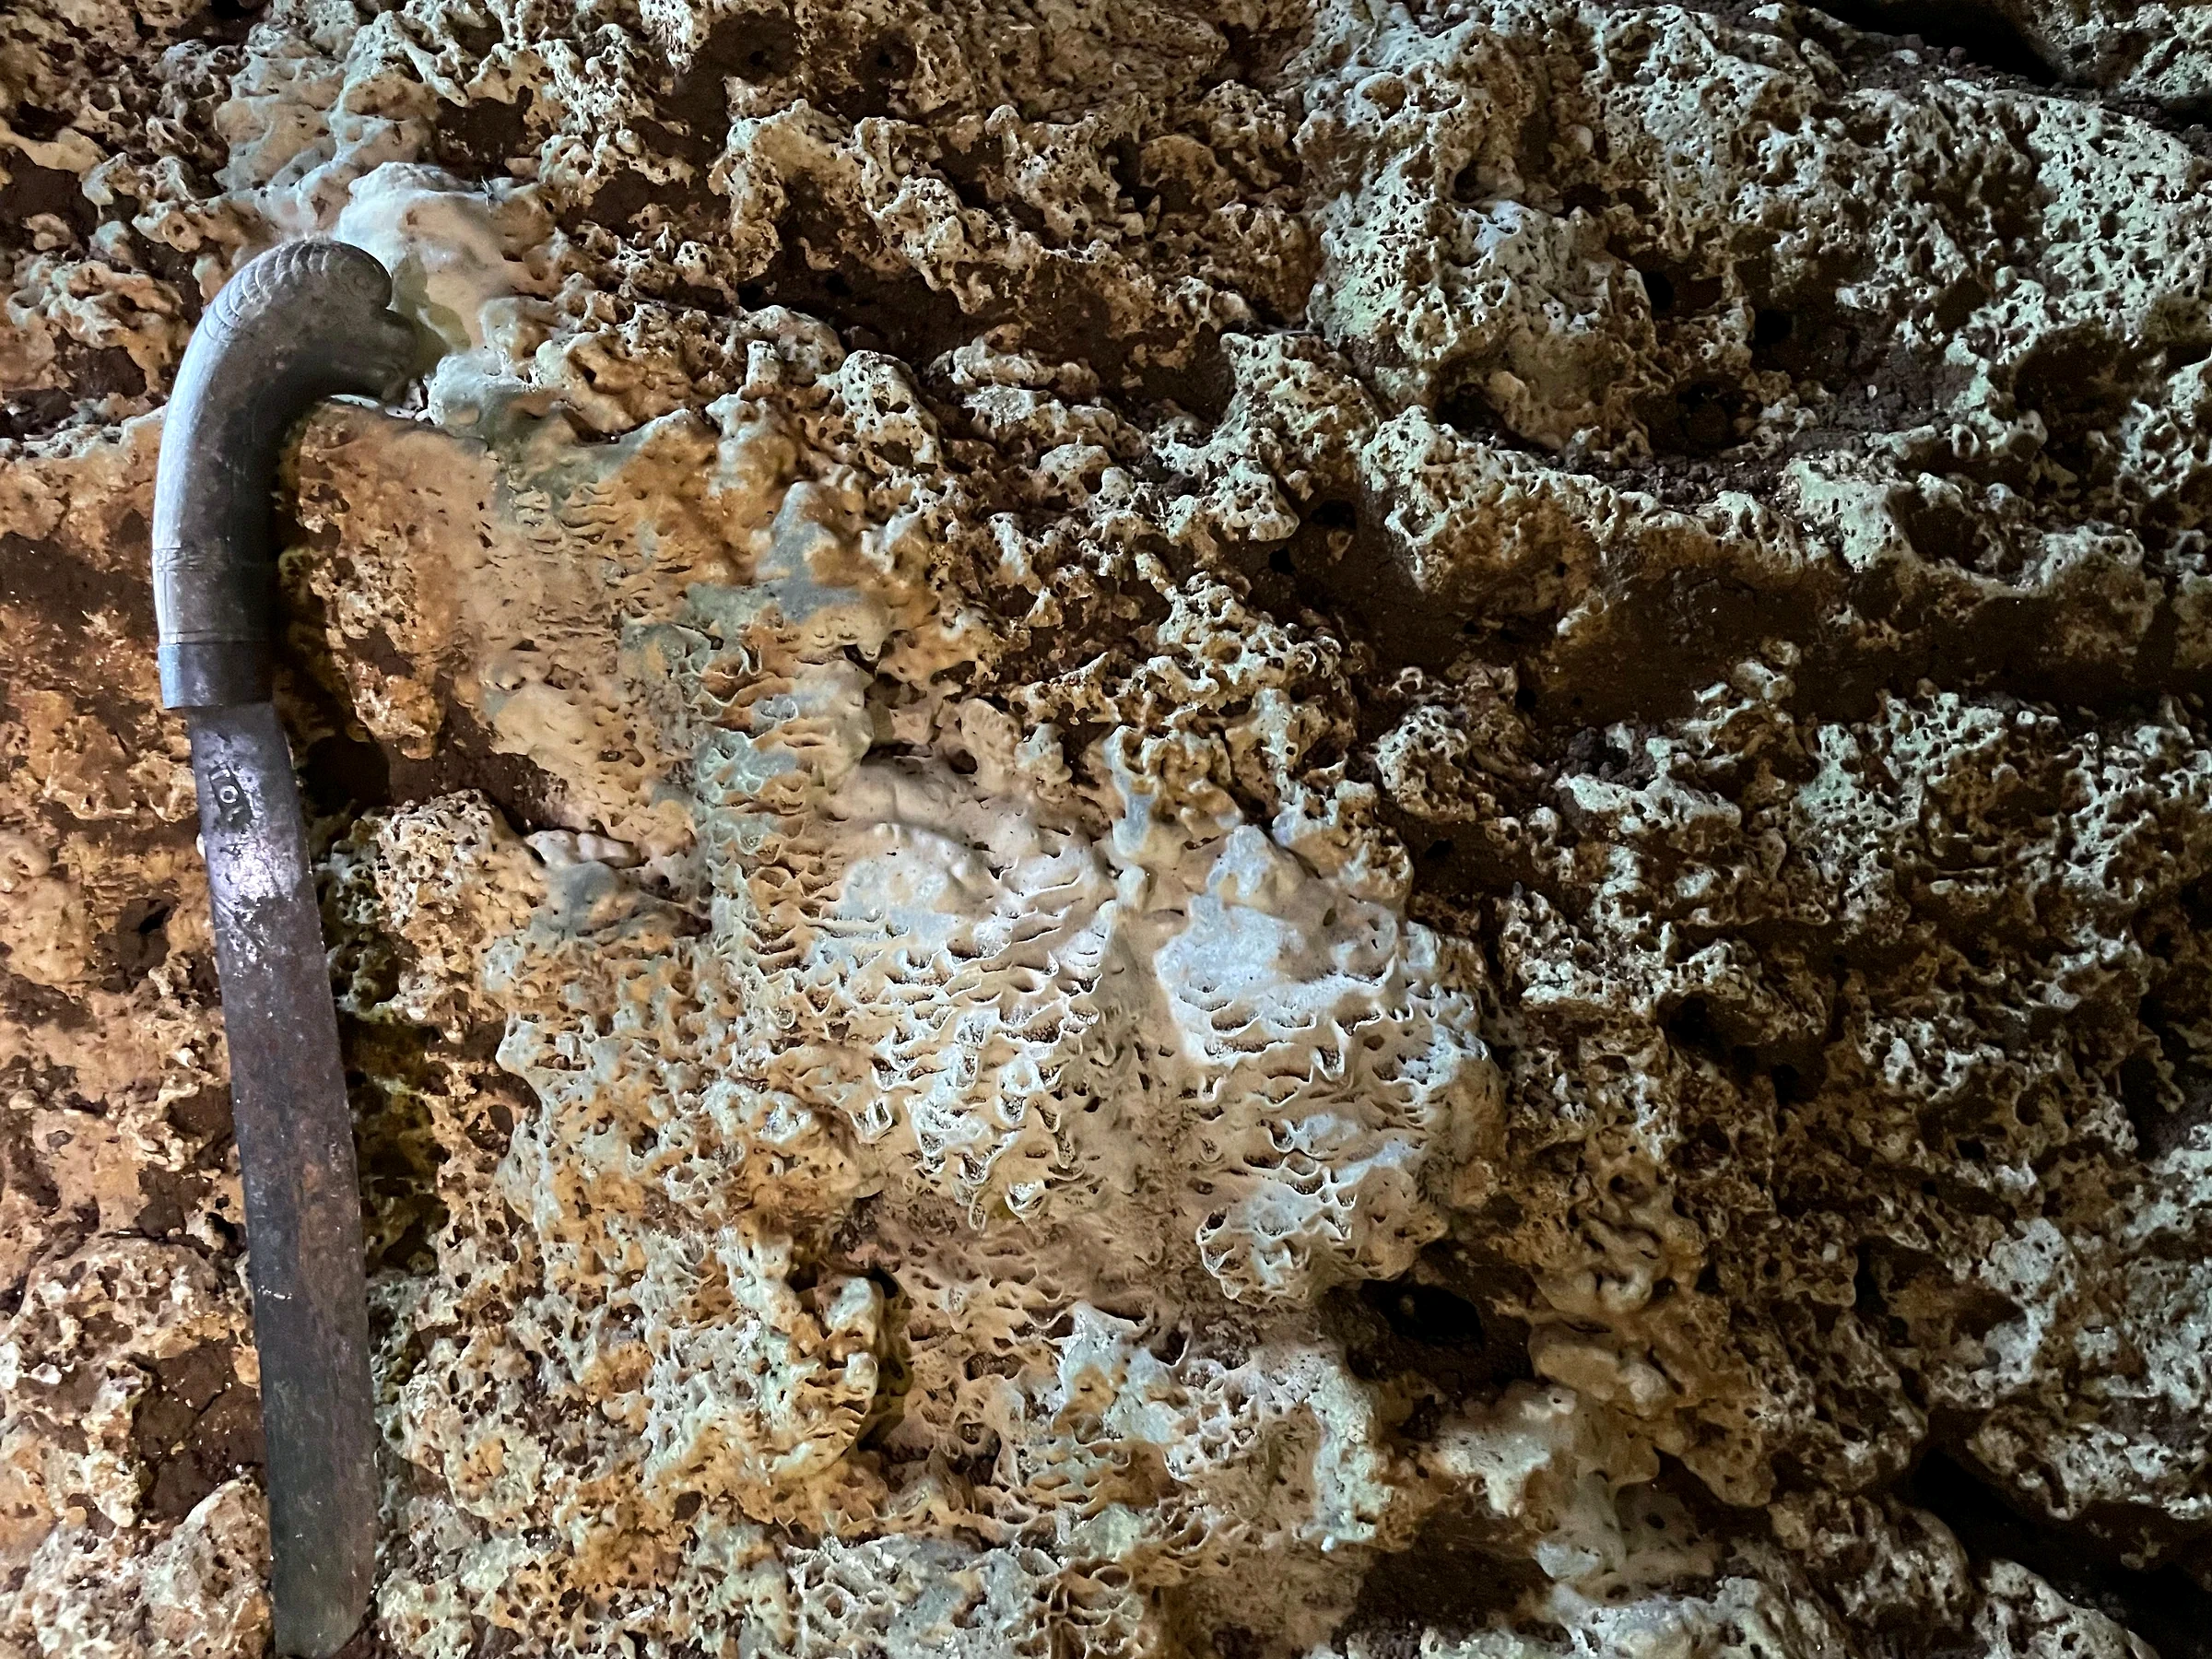
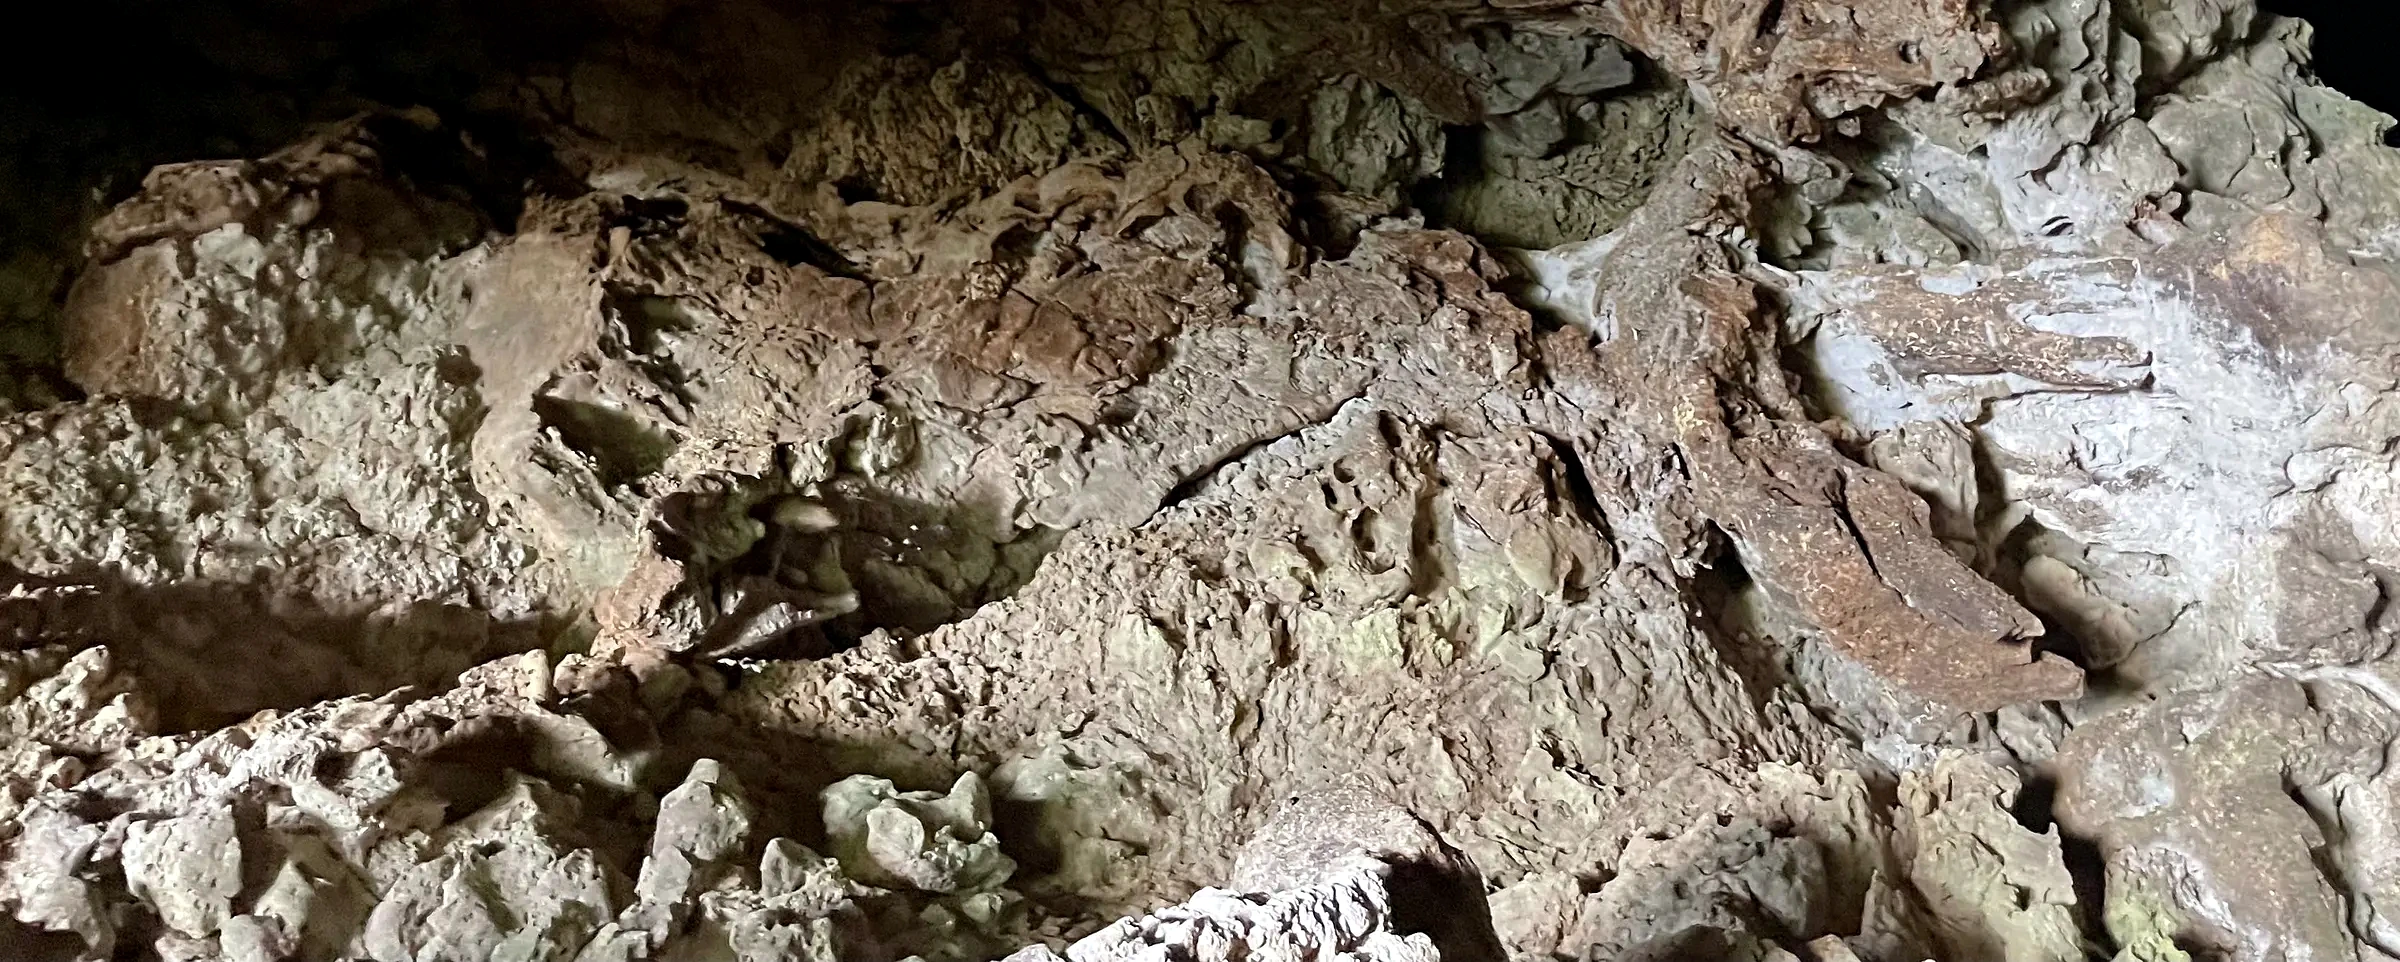
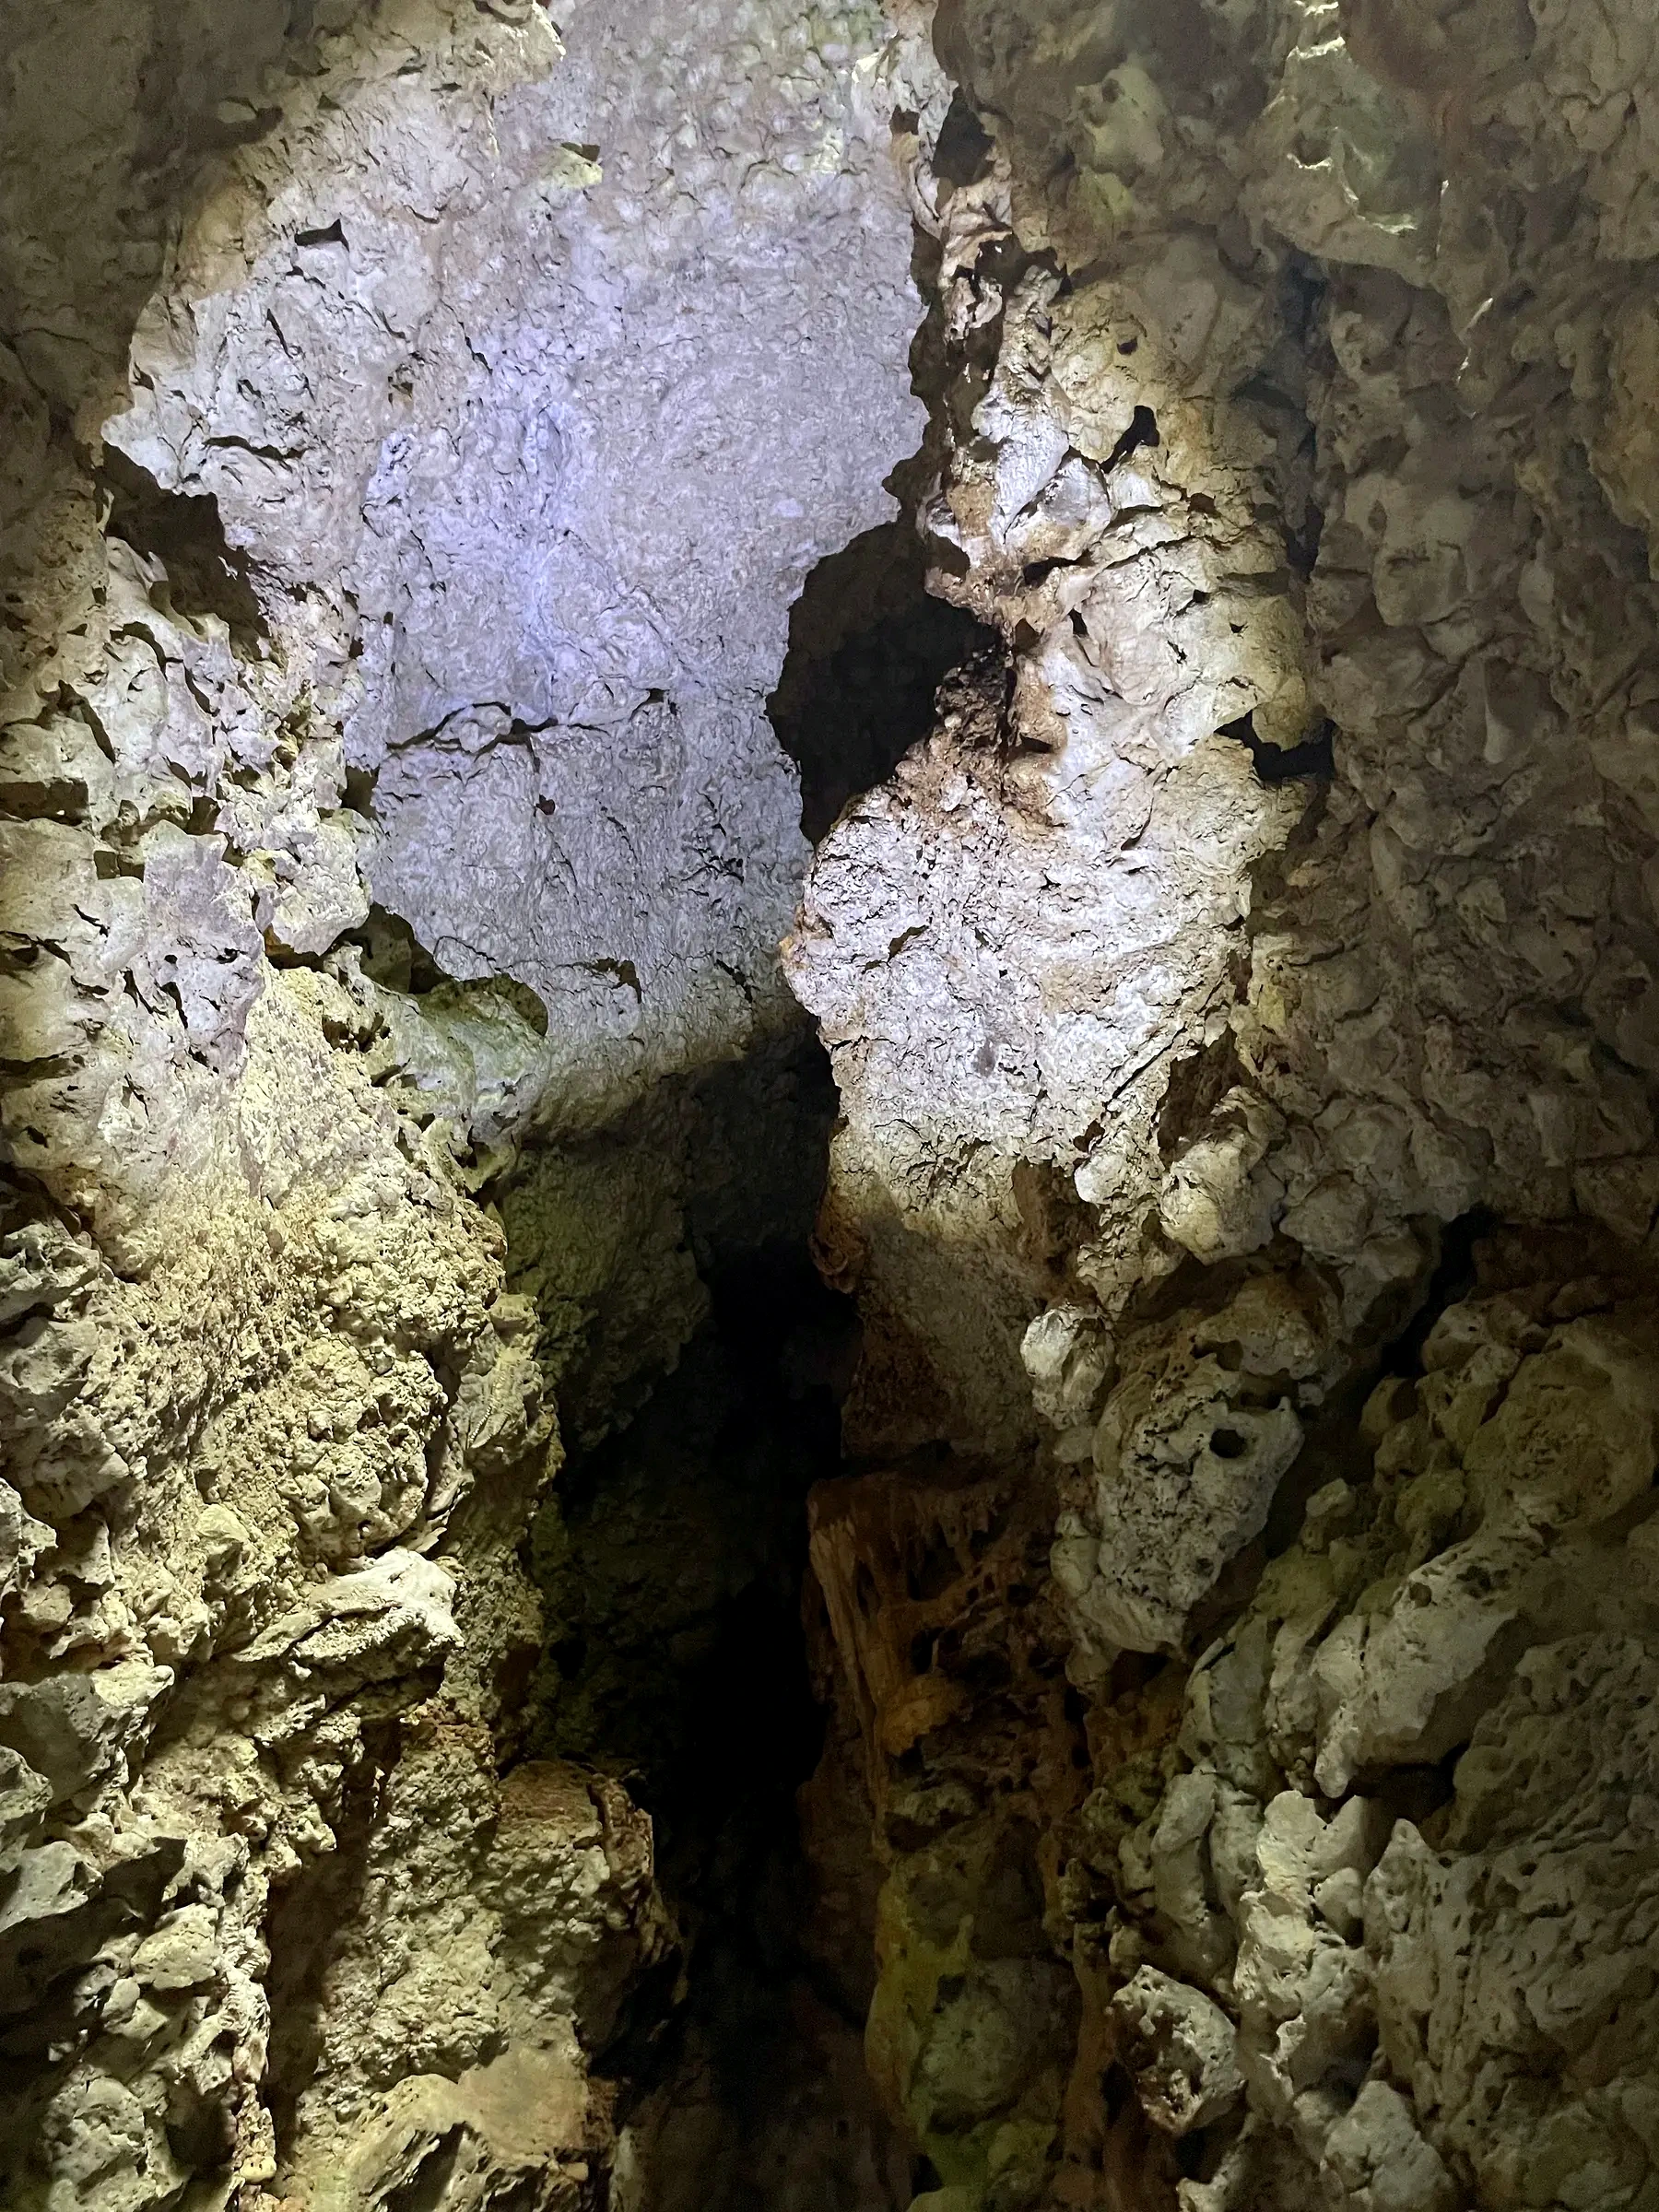
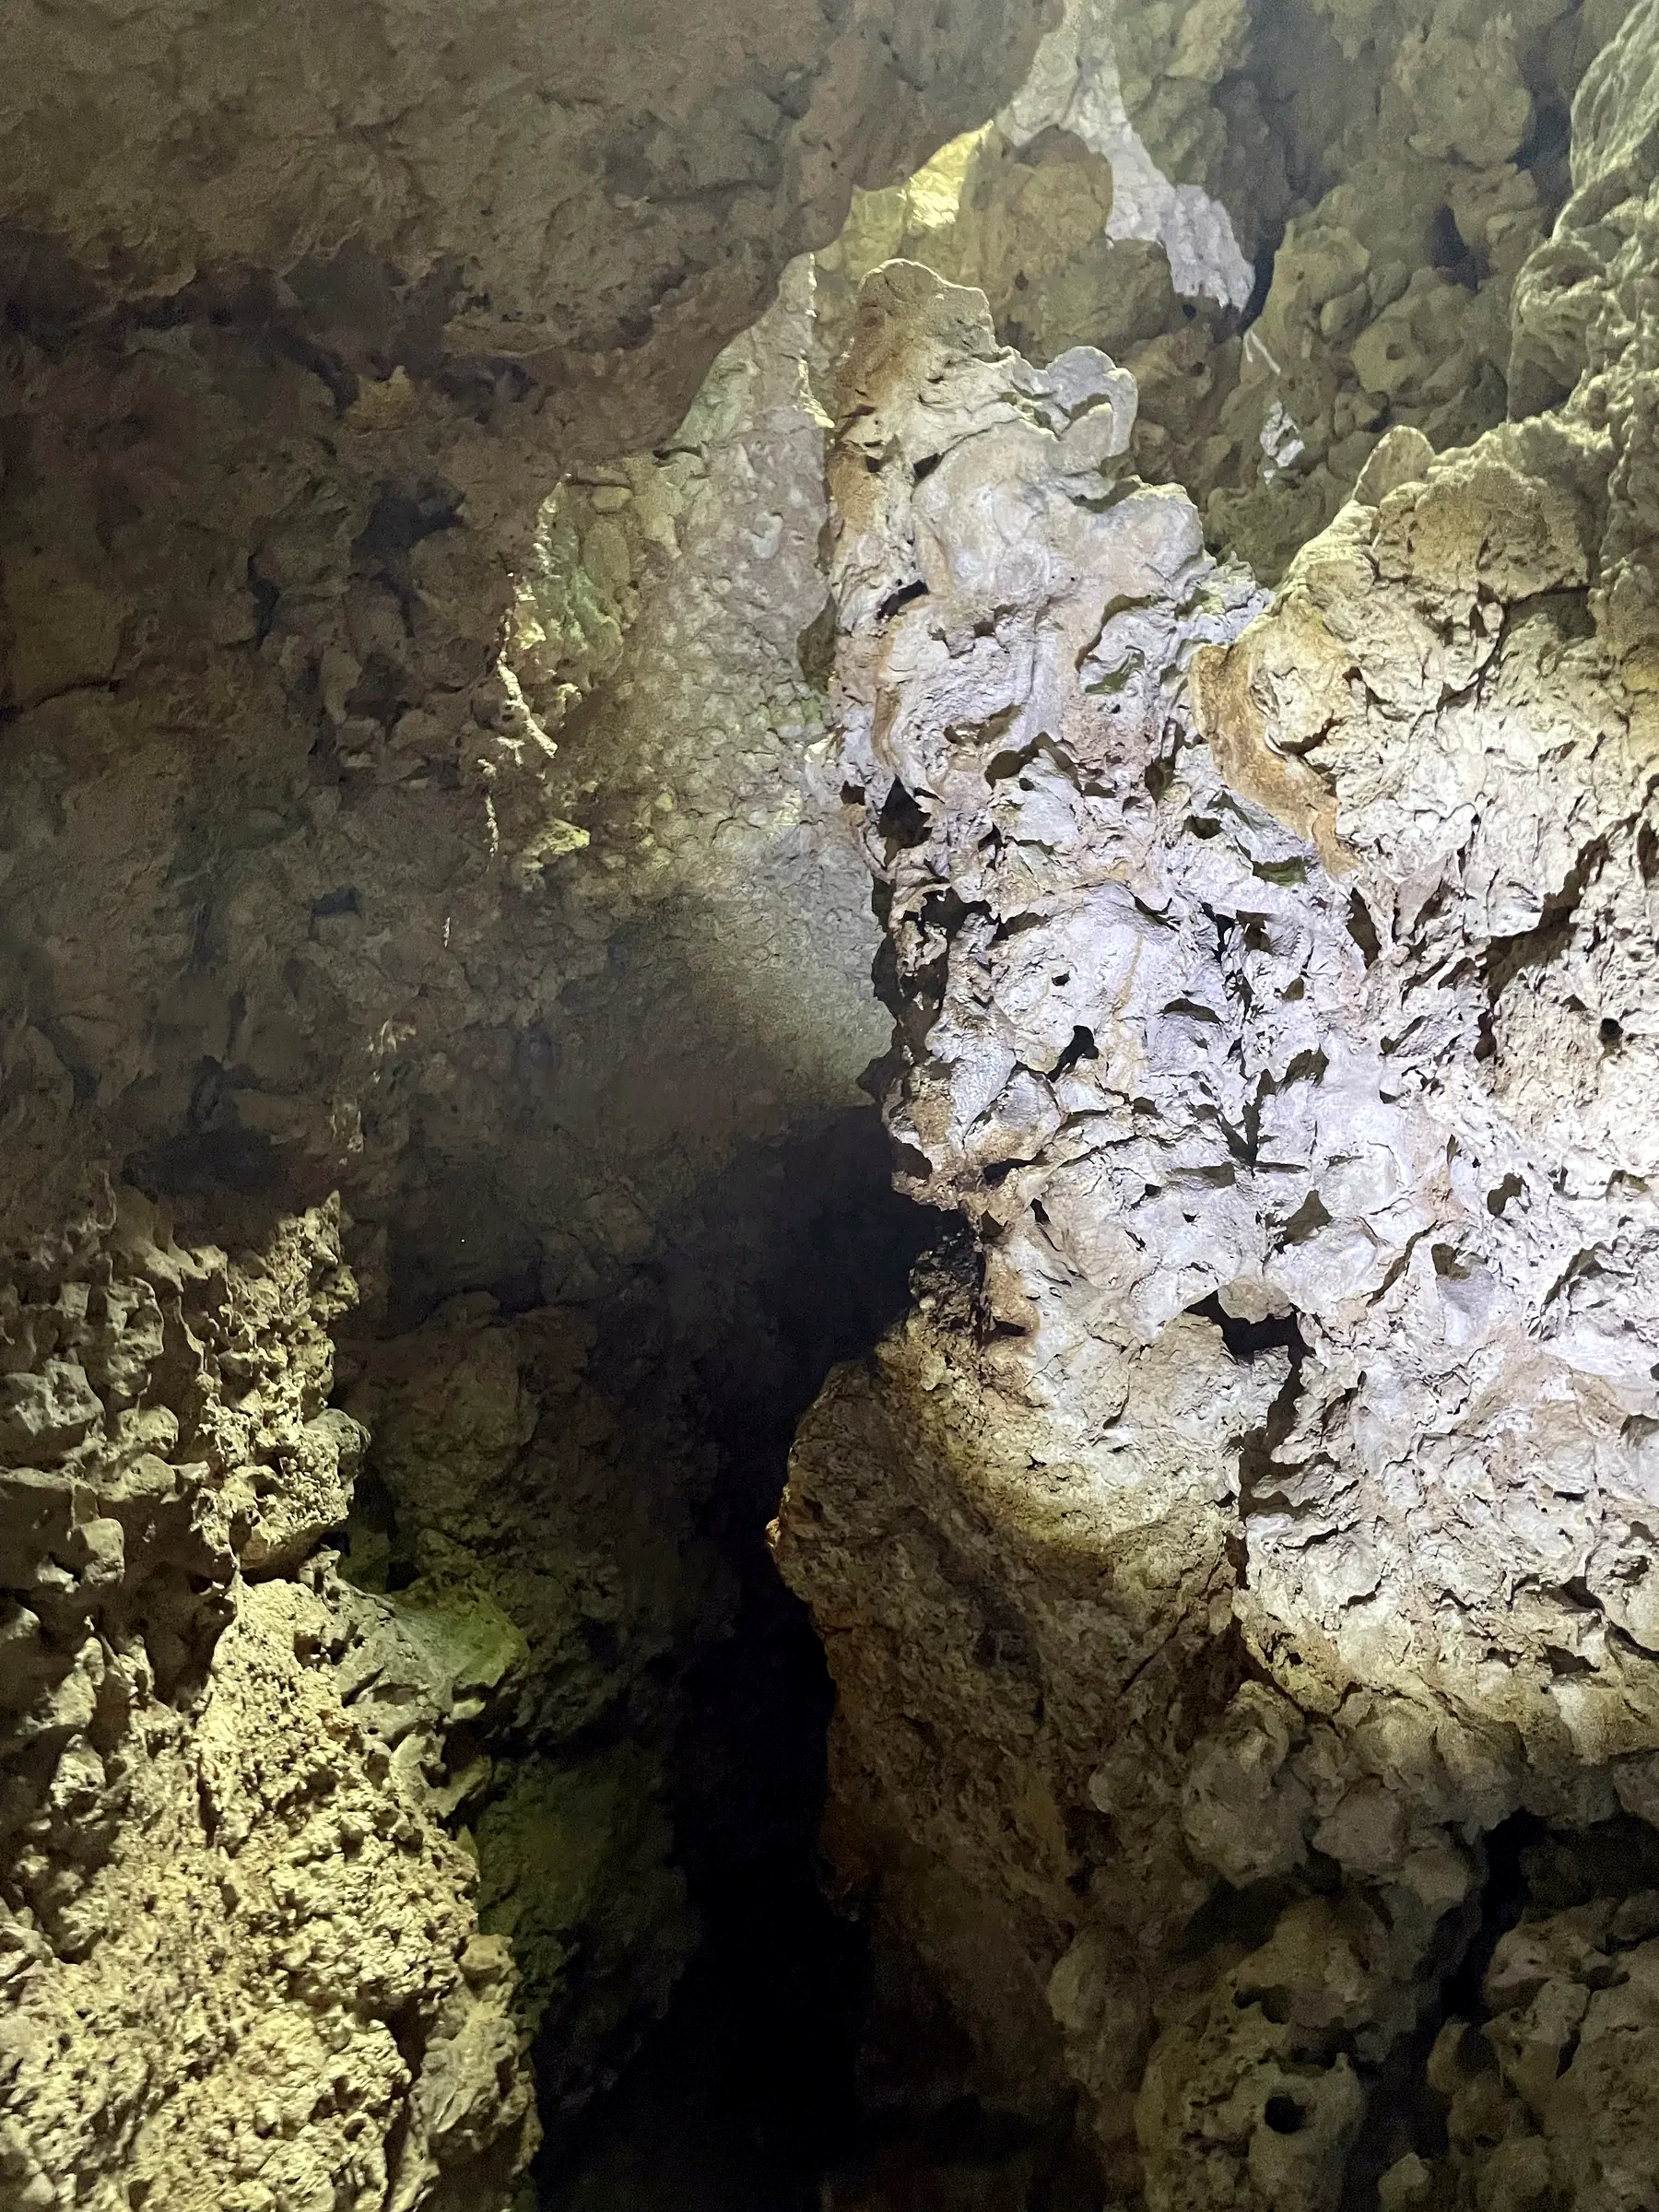
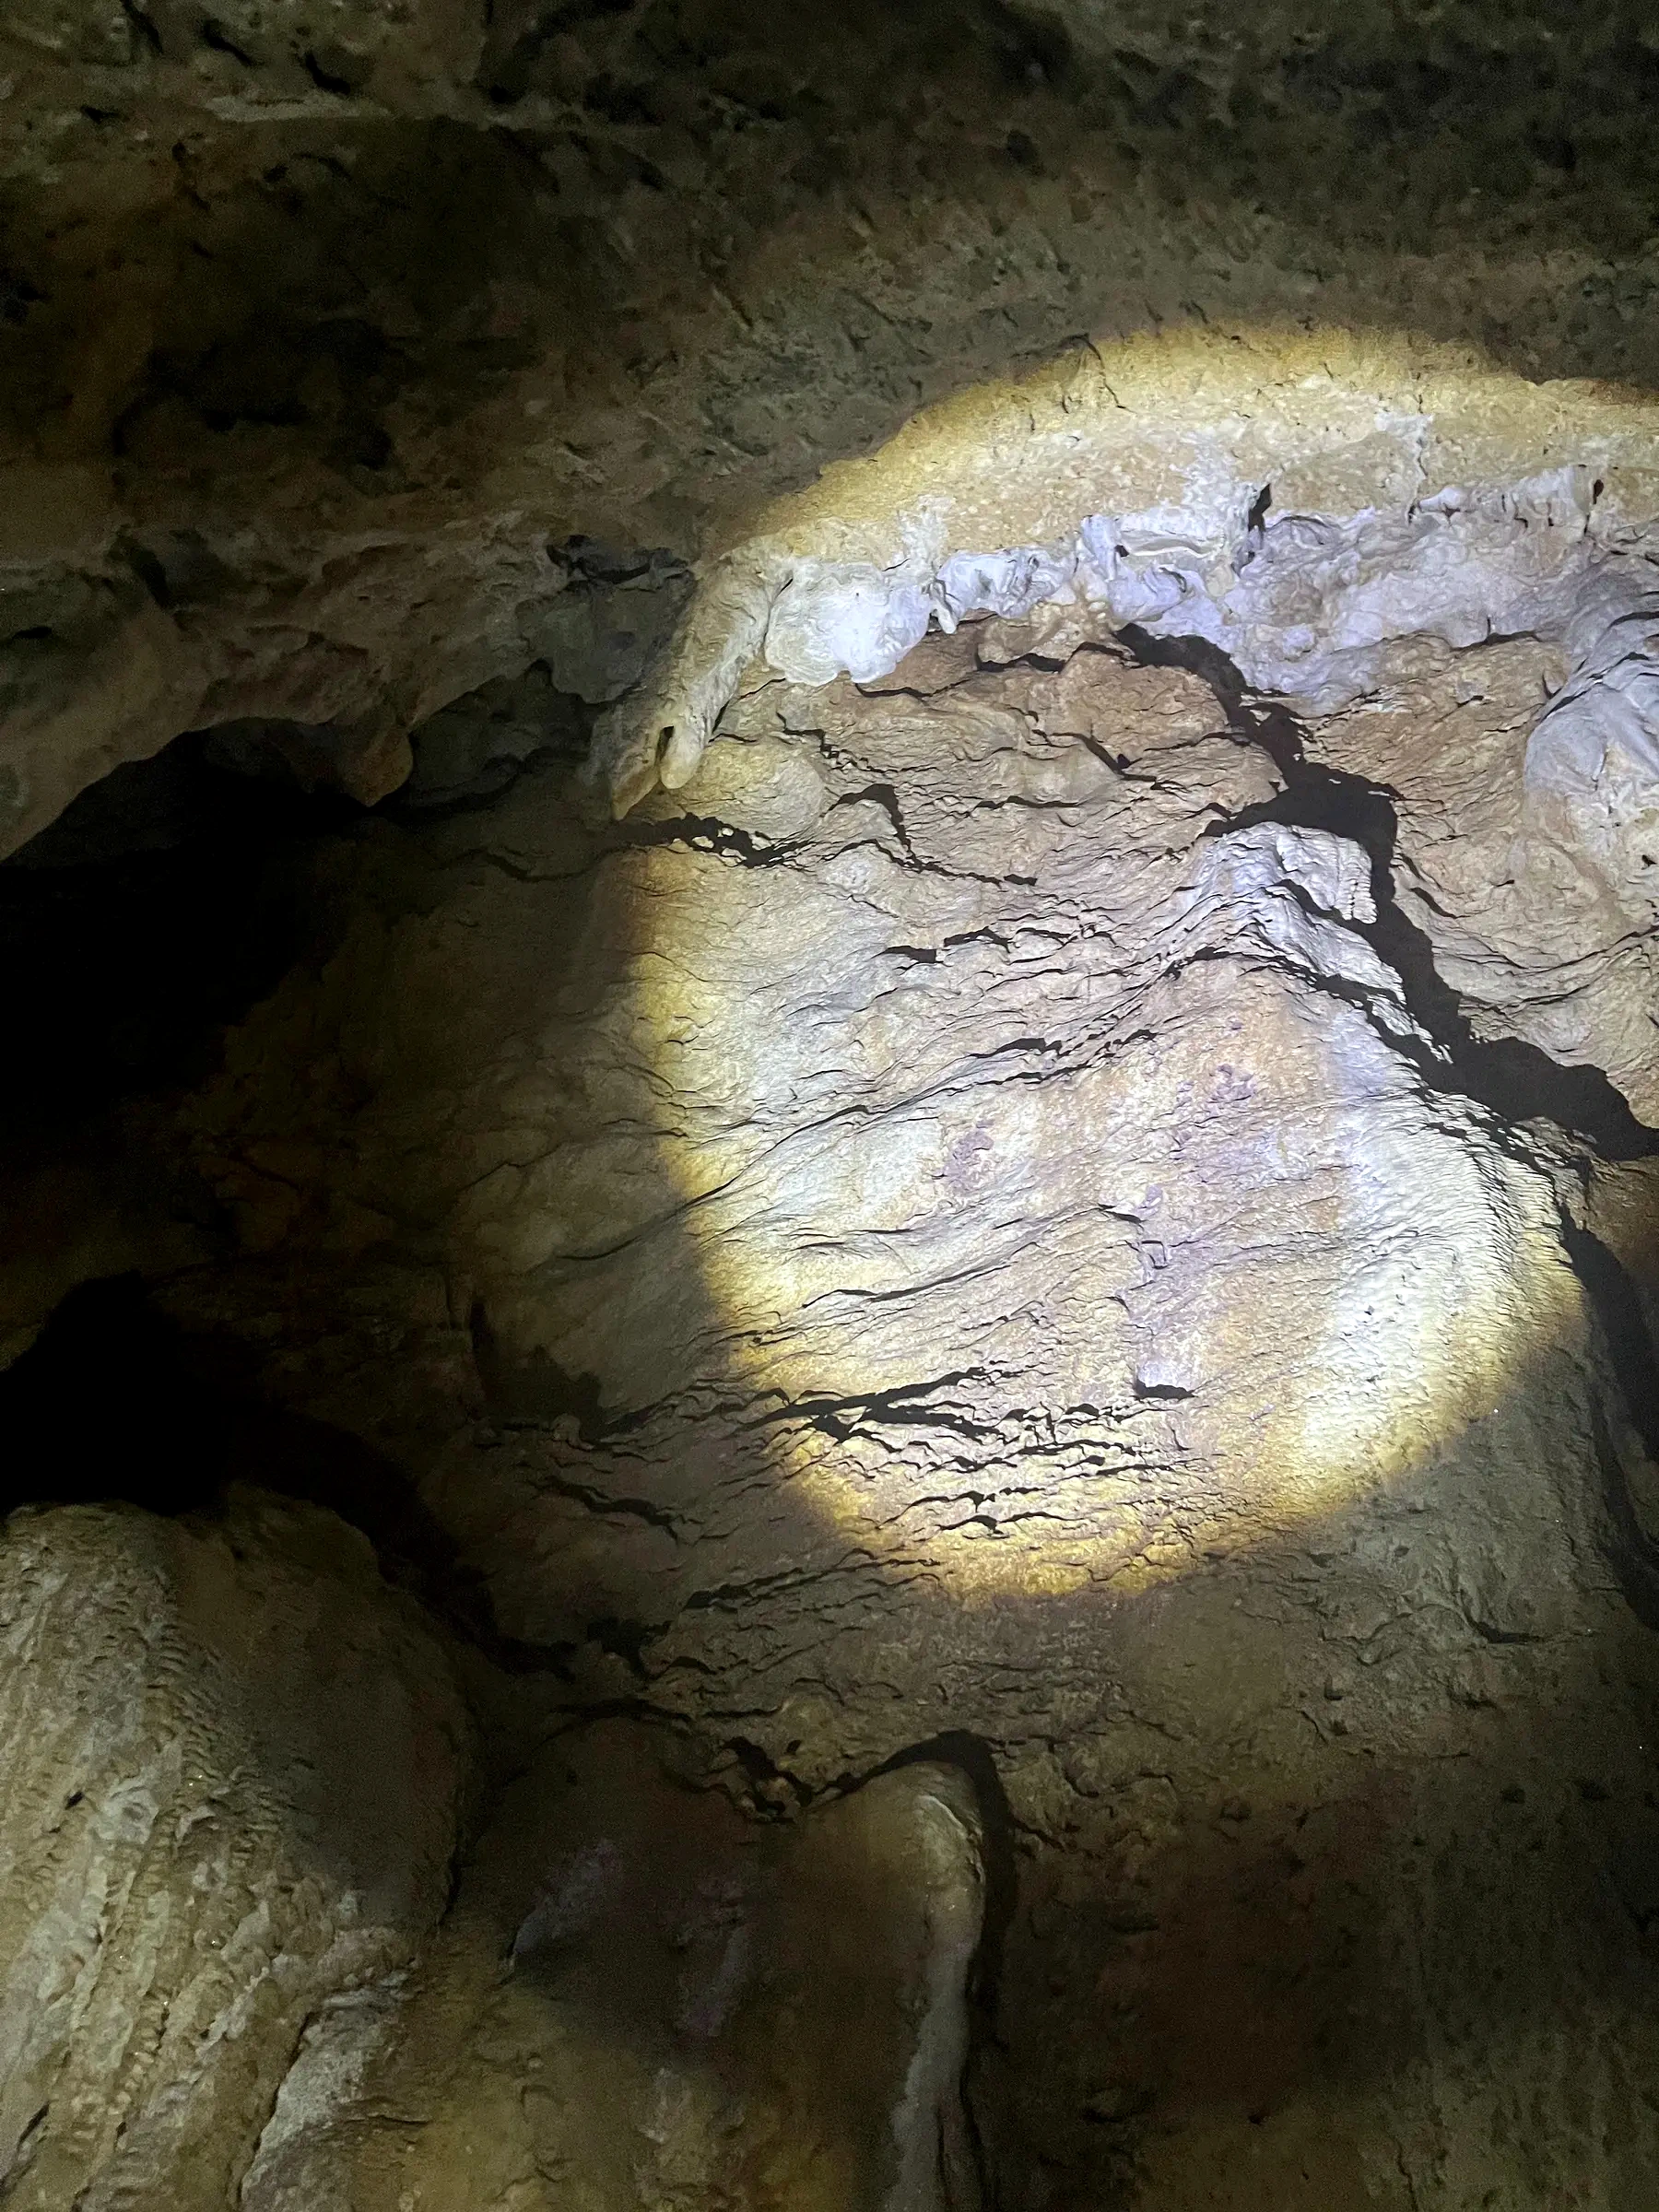
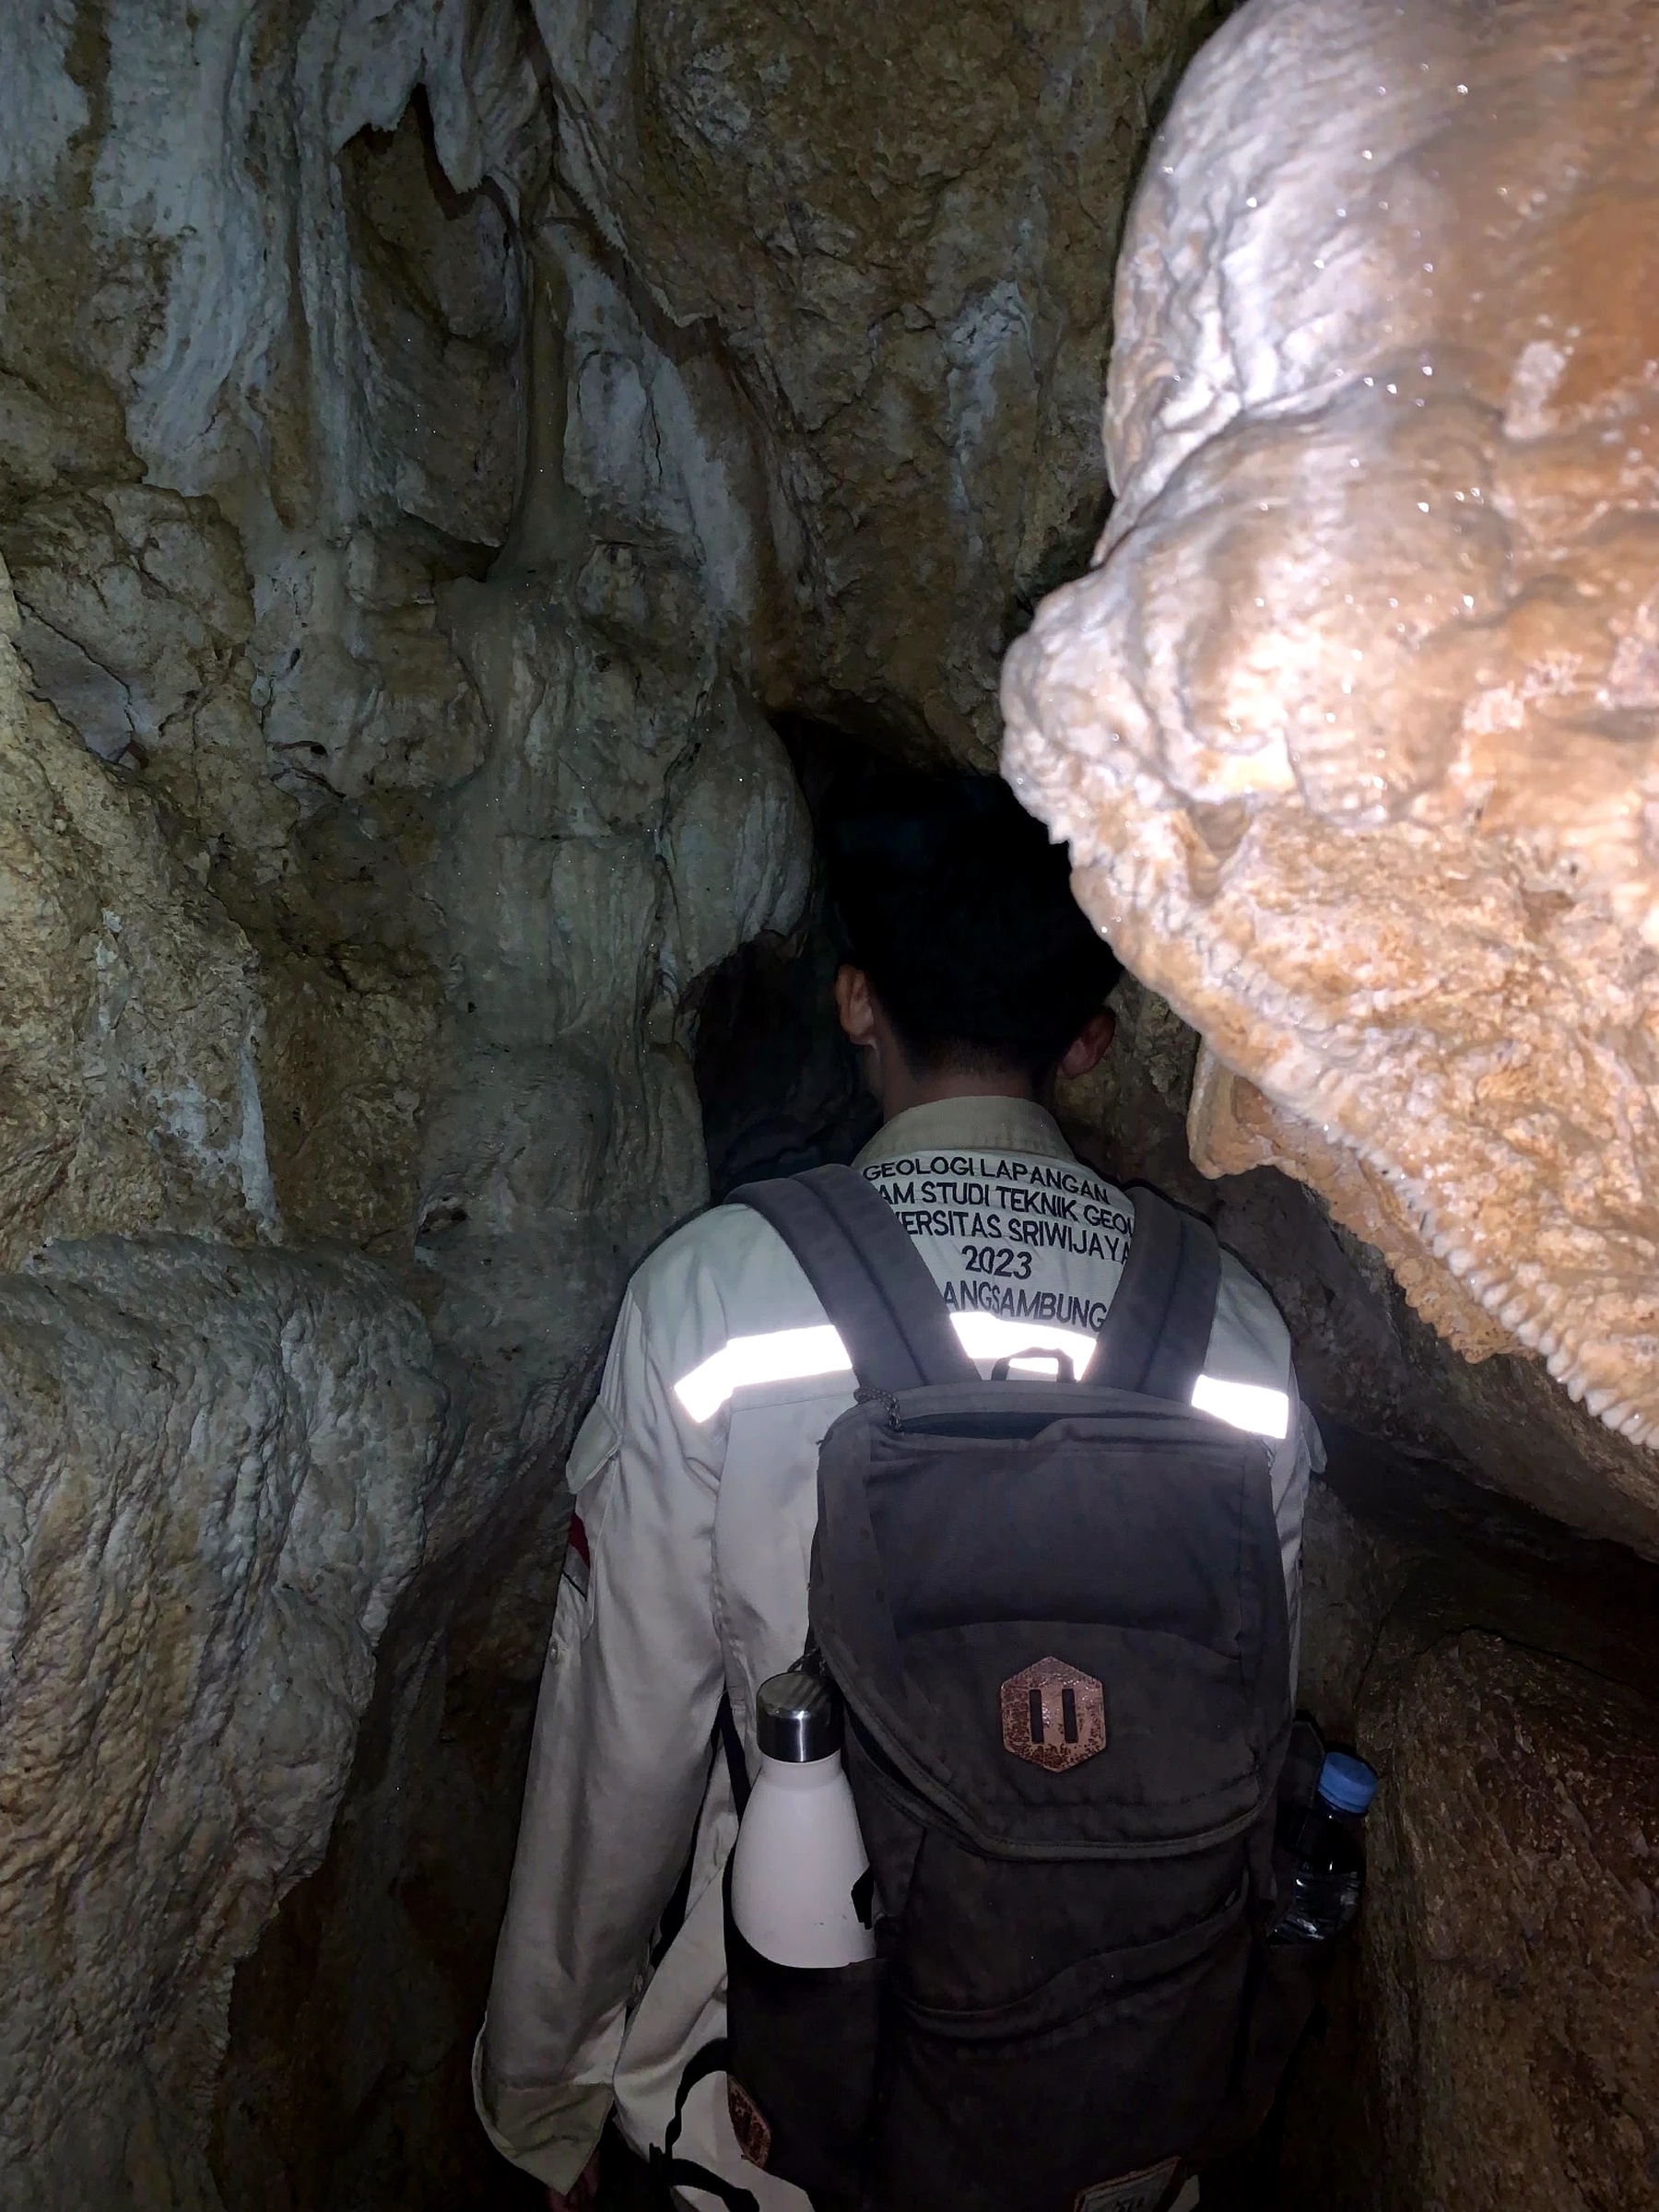
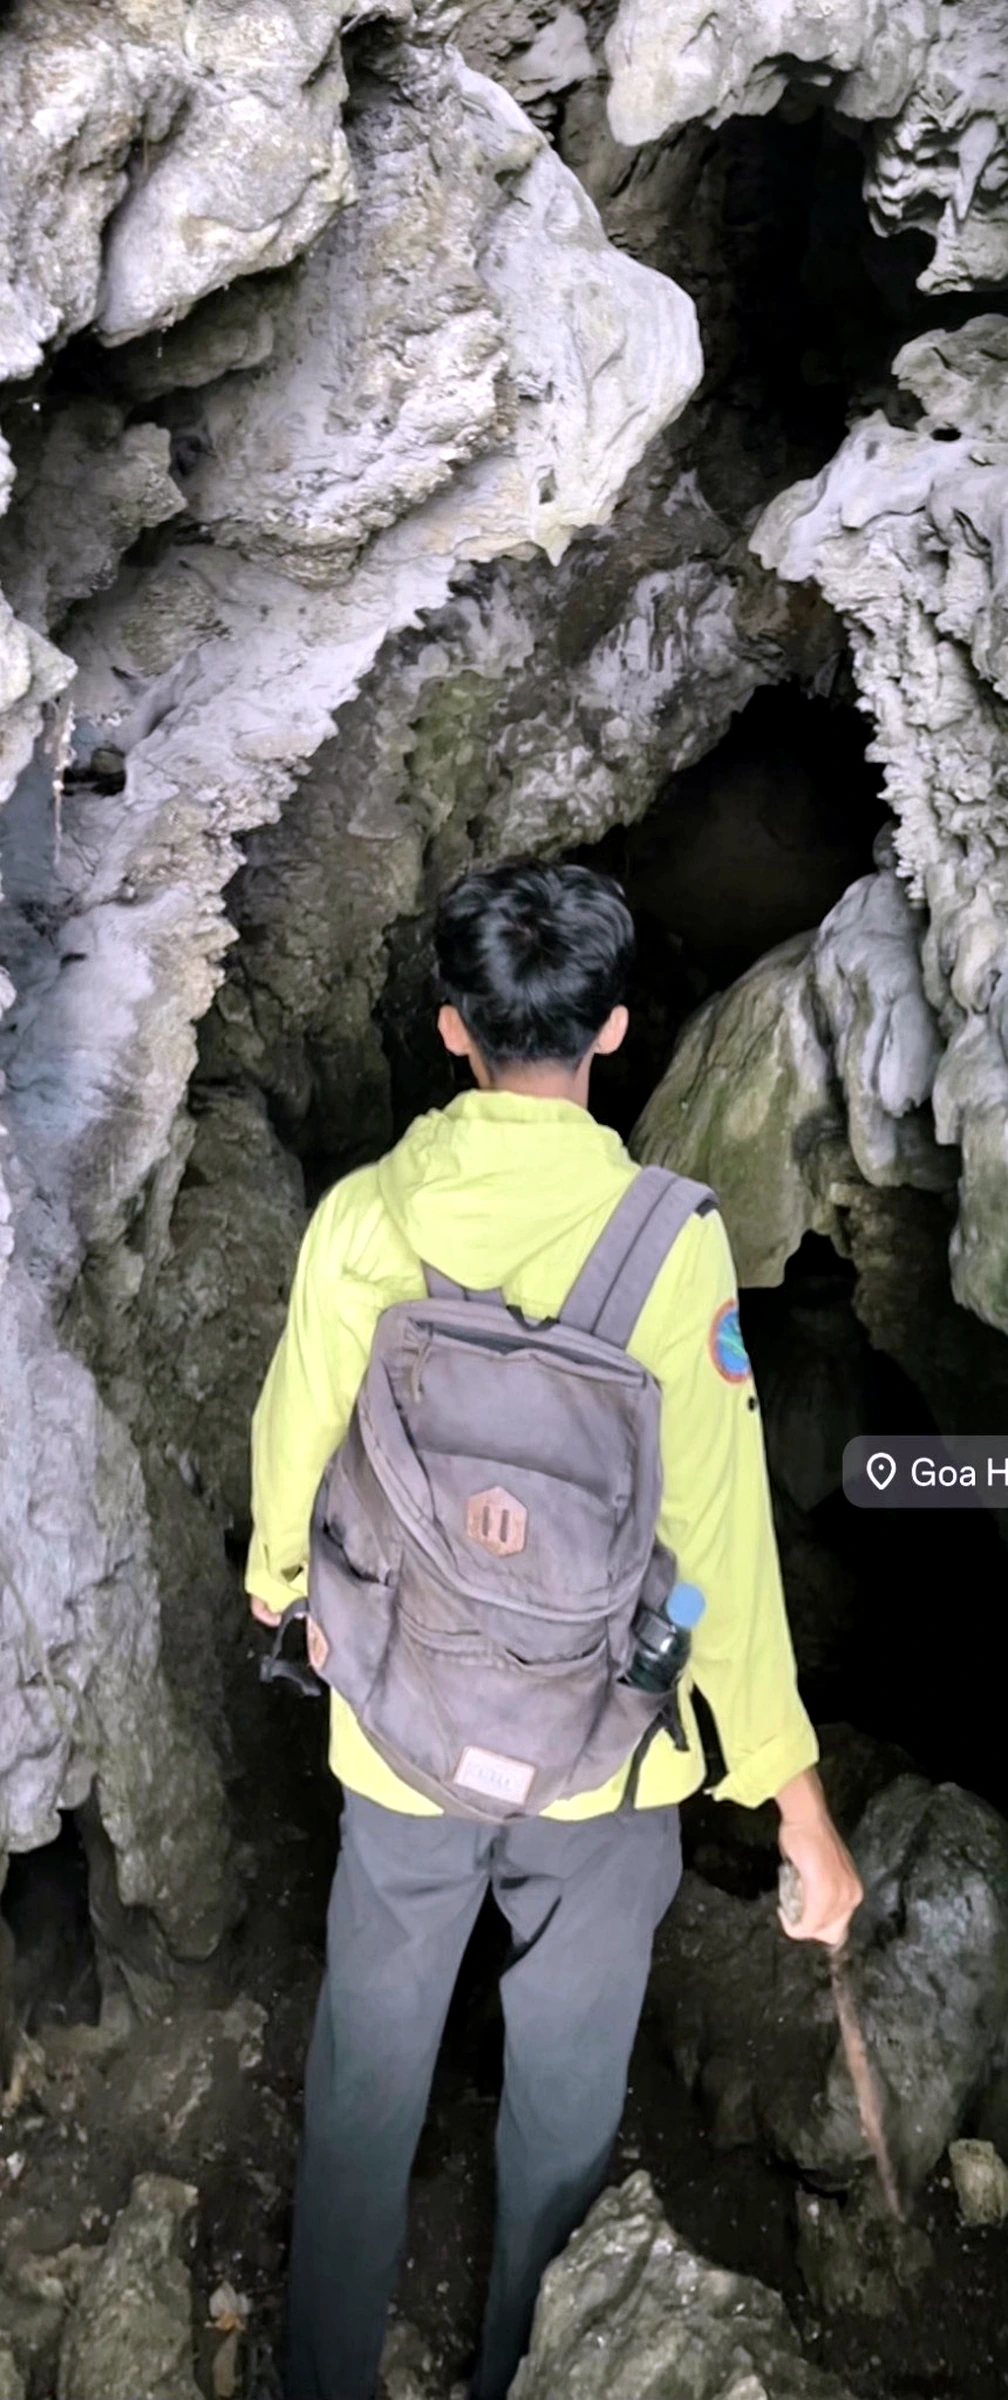
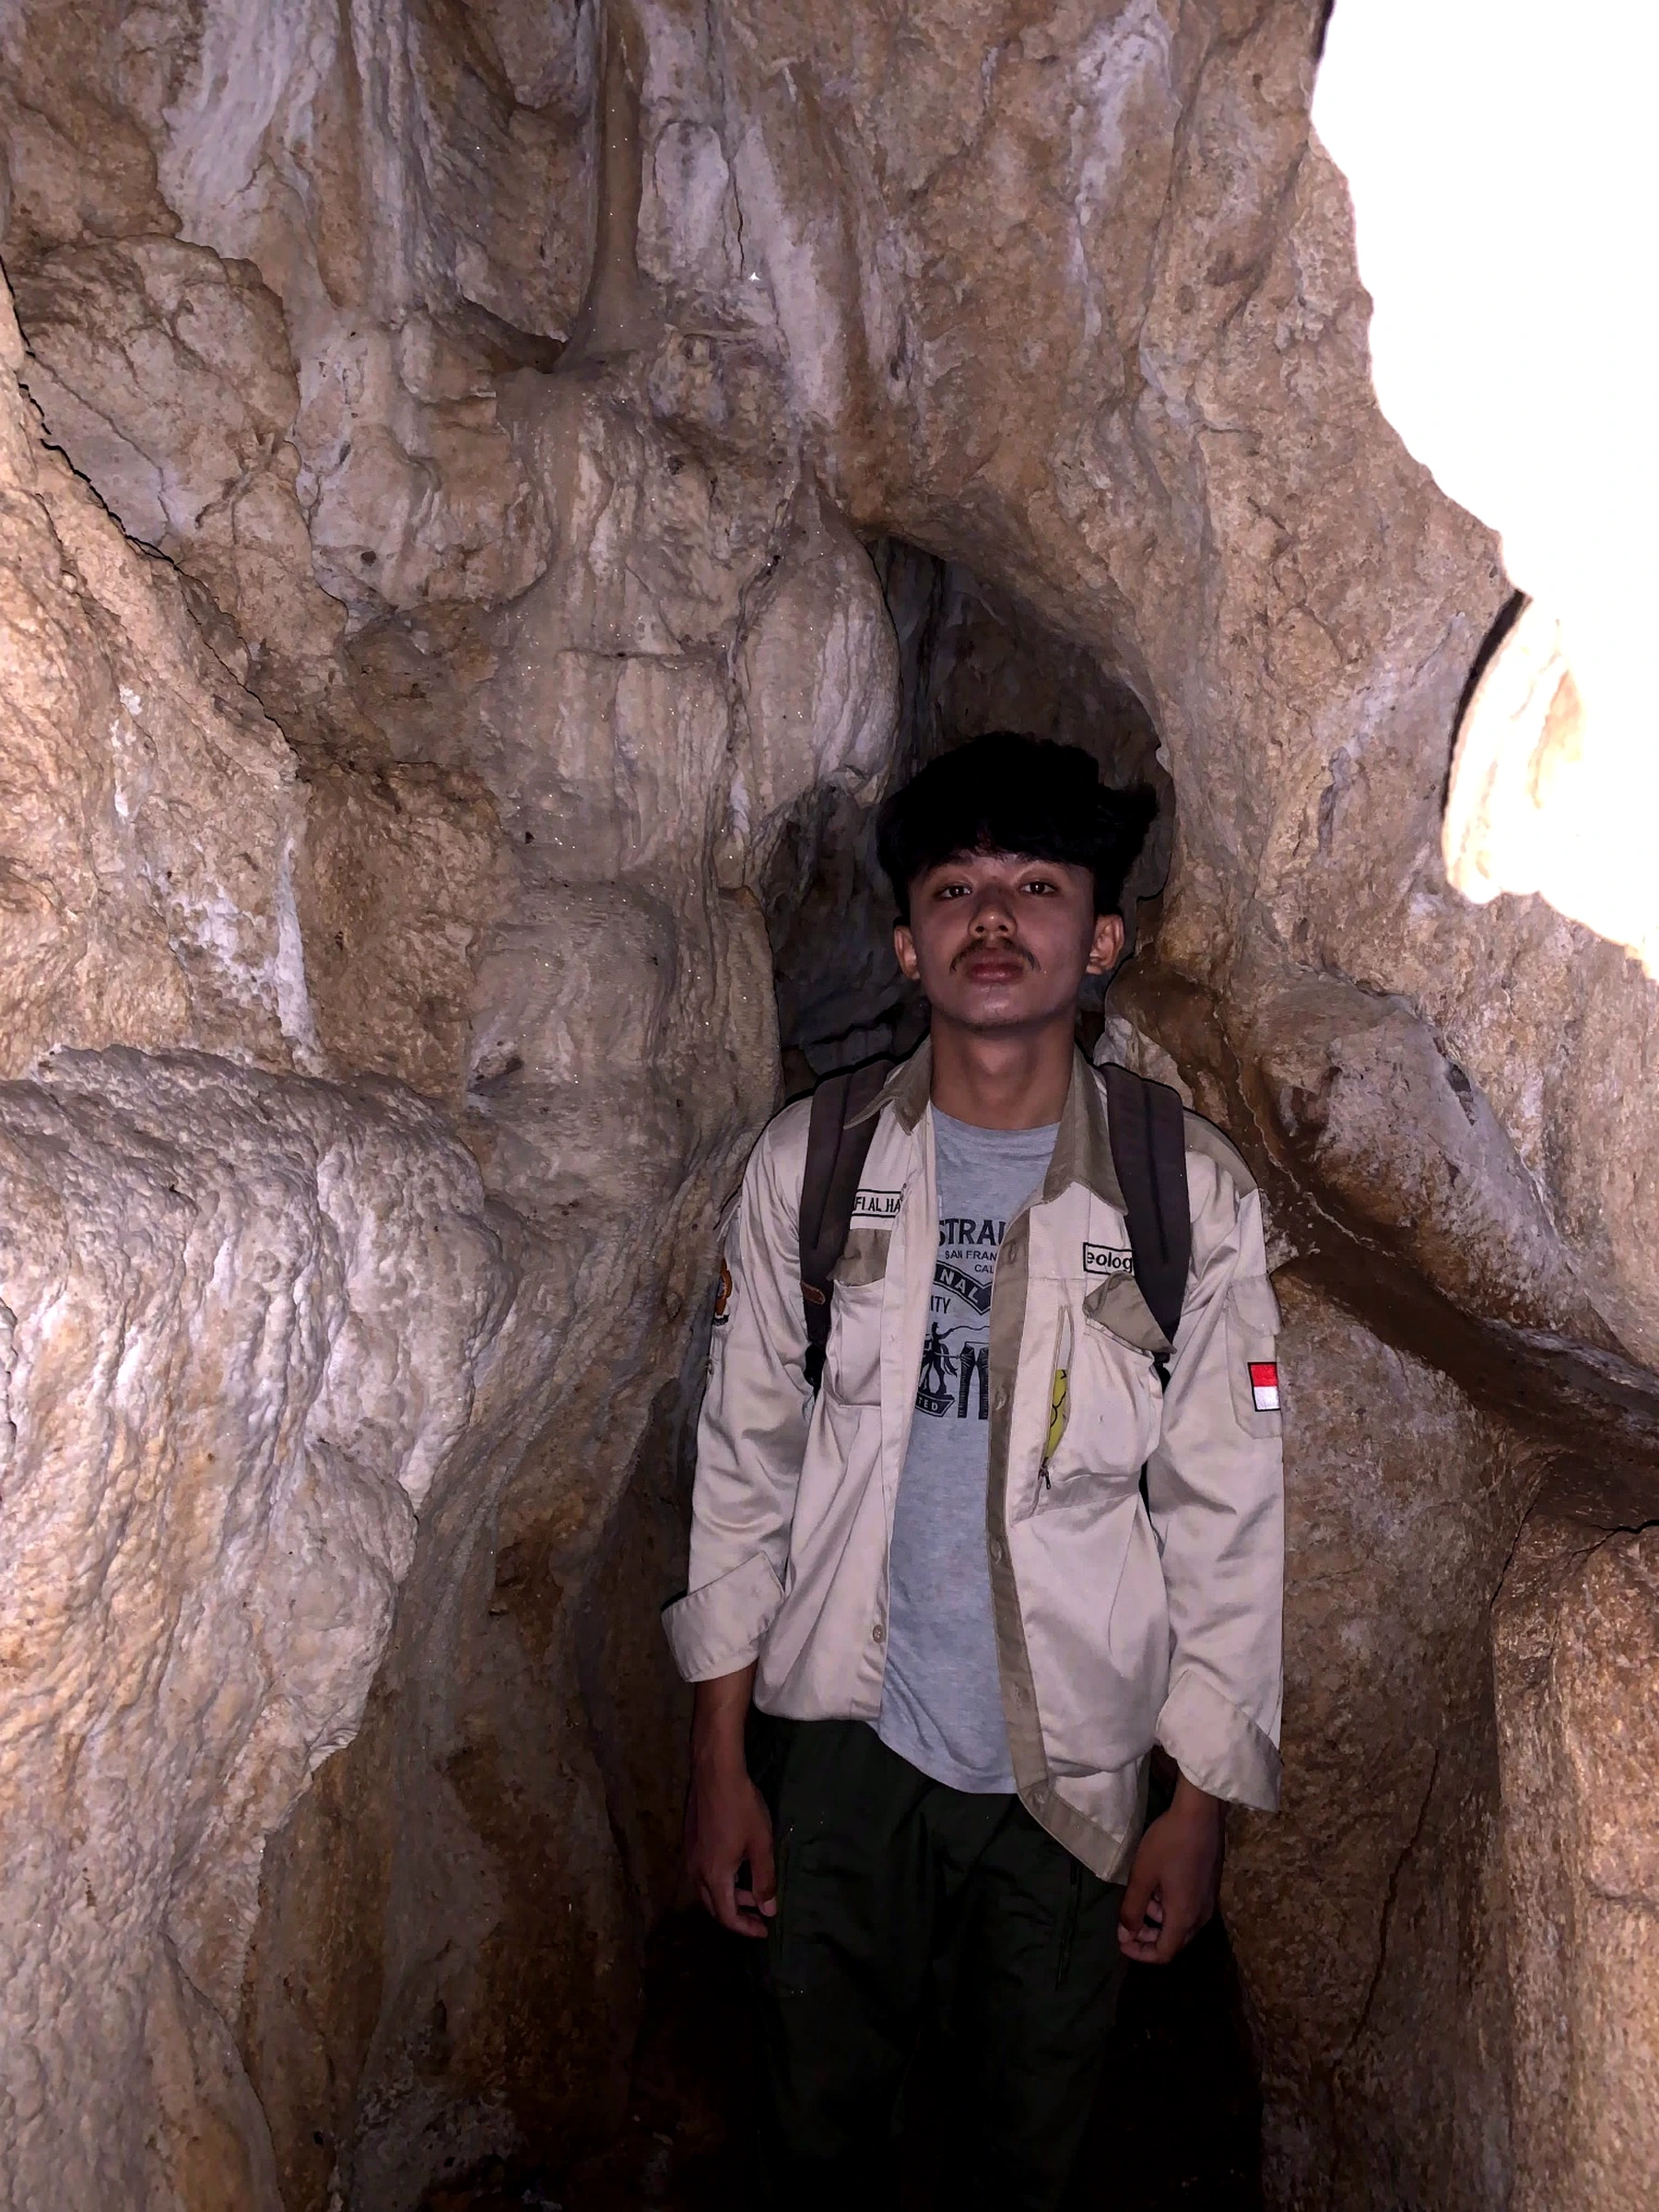
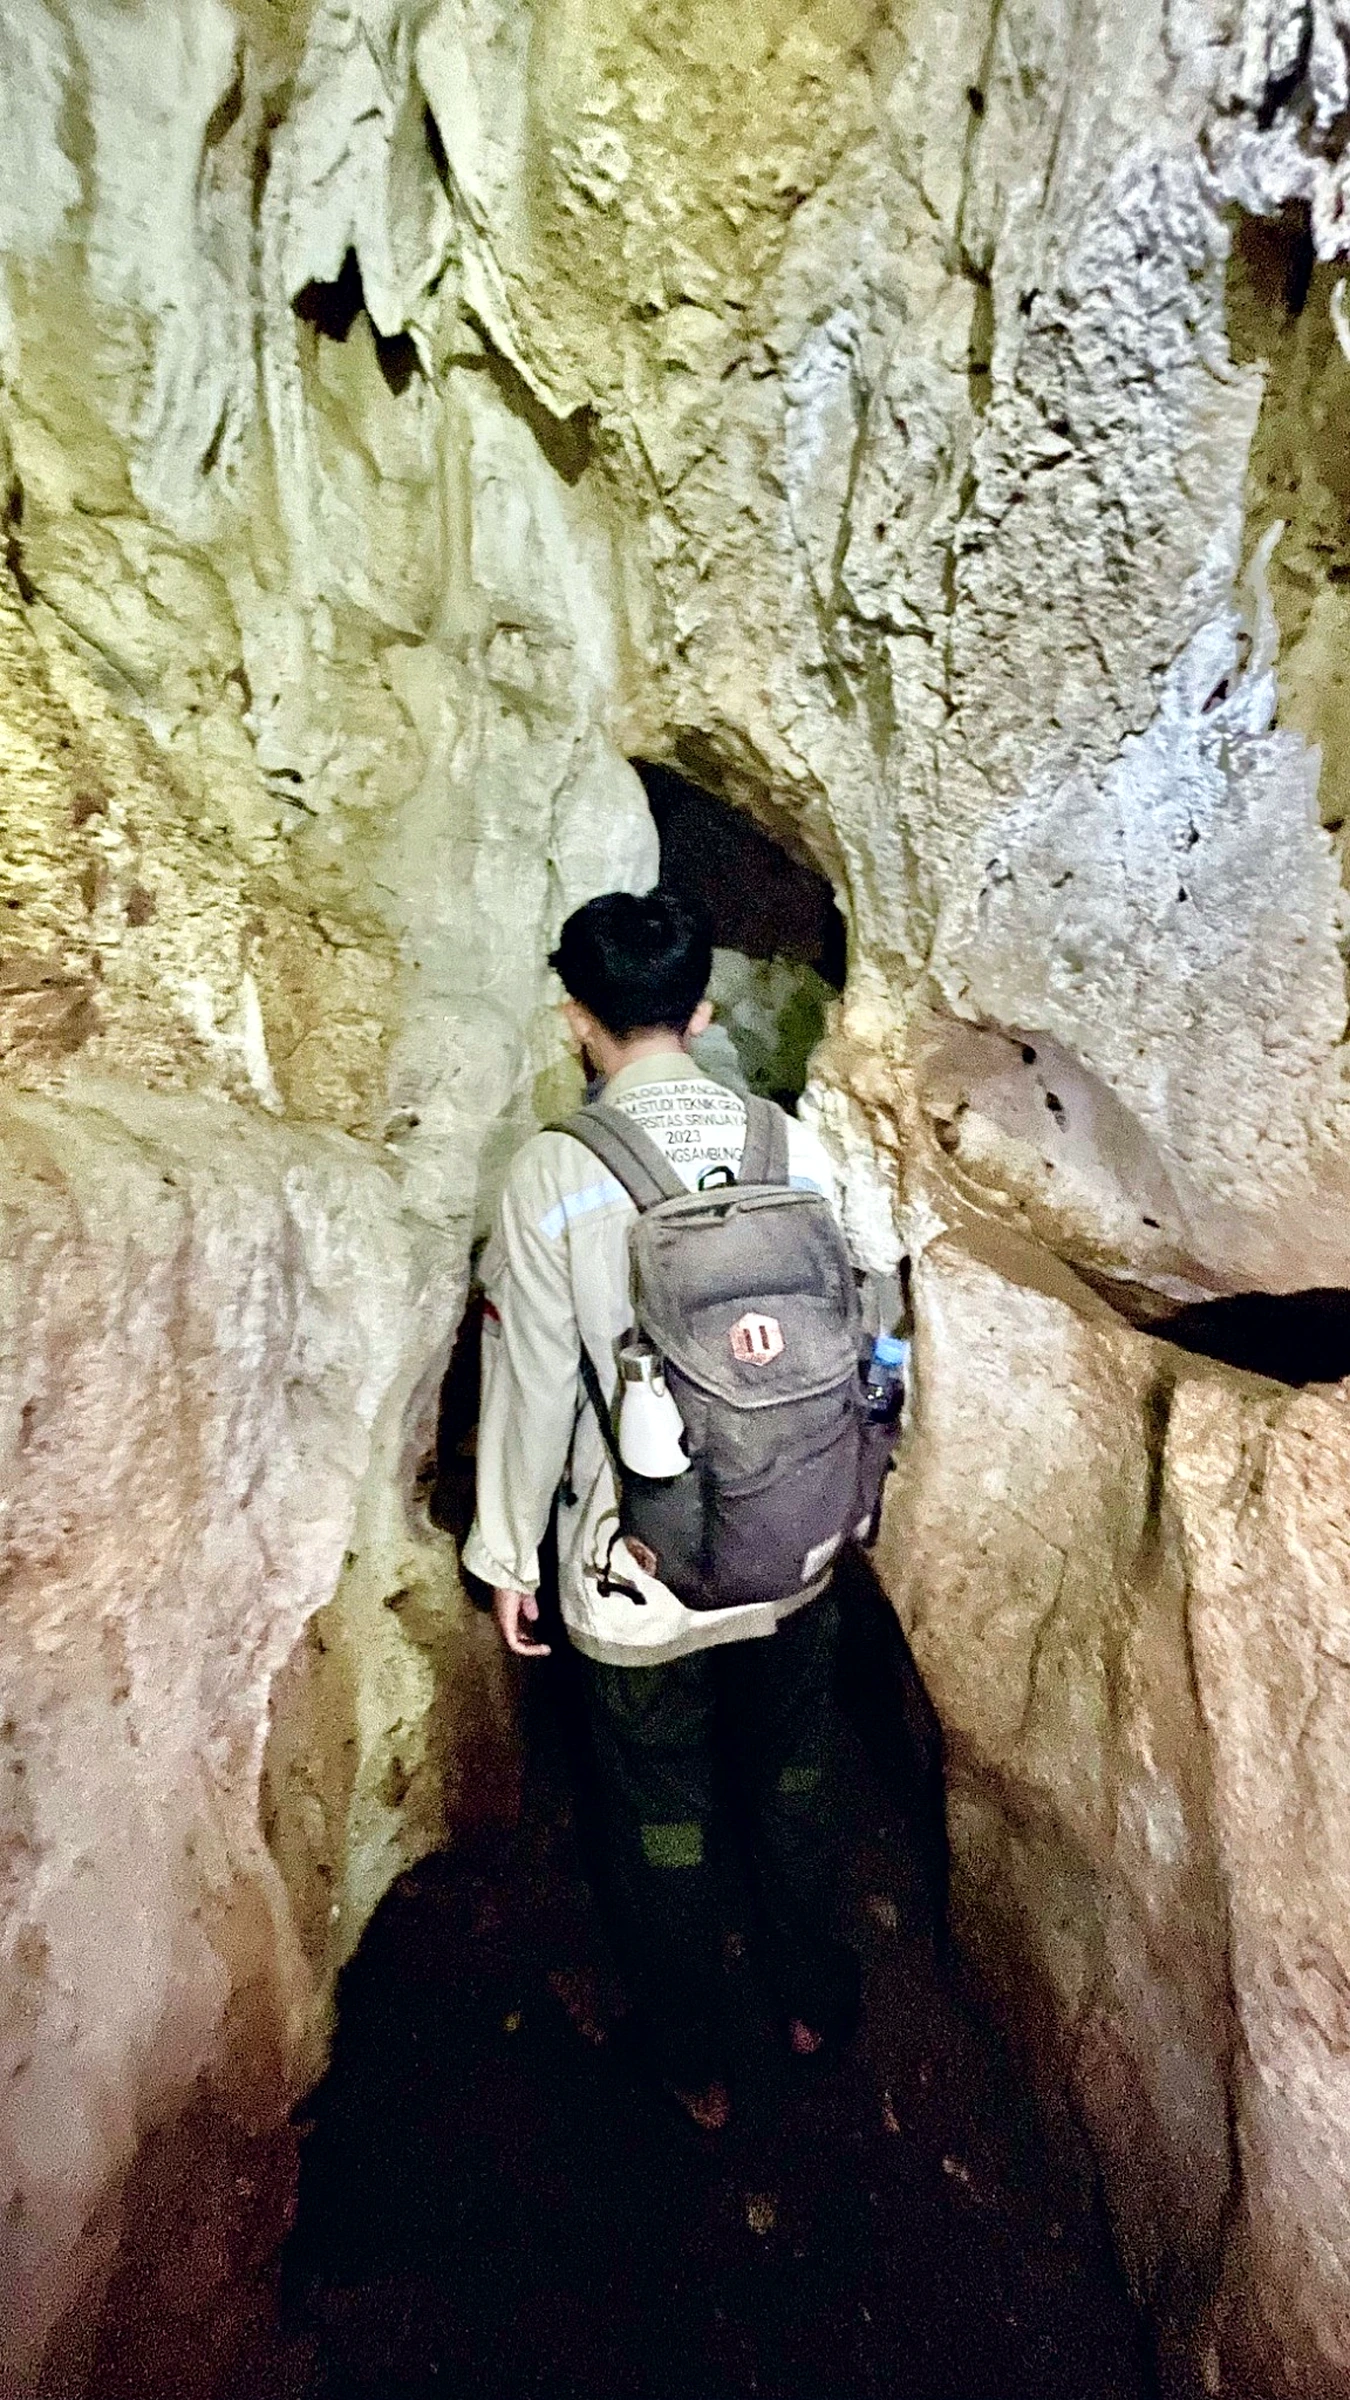
The source report assigns the pale limestone at LP51 and LP82 to the Lebakwangi Member of the Halang Formation and describes a matrix-supported skeletal carbonate with micrite, spar and interparticle or intrafossil porosity. The cave photographs record the later history of that rock: narrow passages, irregular pockets, wall fluting, pendant and sheet-like calcite, coralloid surfaces and one clearly fracture- or joint-guided cavity. The sequence is most consistently read as structurally inherited permeability enlarged by dissolution, followed in places by secondary carbonate precipitation as water chemistry and flow regime changed. It is not evidence that every visible cavity formed at the same time, nor that every photographed wall preserves primary reef framework. A reef interpretation belongs to microfacies and growth fabric—bound organisms in life position, framework support and coherent ecological construction—not to pale colour or cavernous weathering alone. Passage survey, bedding and joint orientation, spring and sink mapping, seasonal hydrology, water chemistry and safe tracer testing would be needed to move from cave morphology to a groundwater model. The photographs remain image-led because their value is spatial and textural; the paragraph defines what they collectively support and where that support ends.
ROCK OUTCROP · SUPPORTING CONTEXT
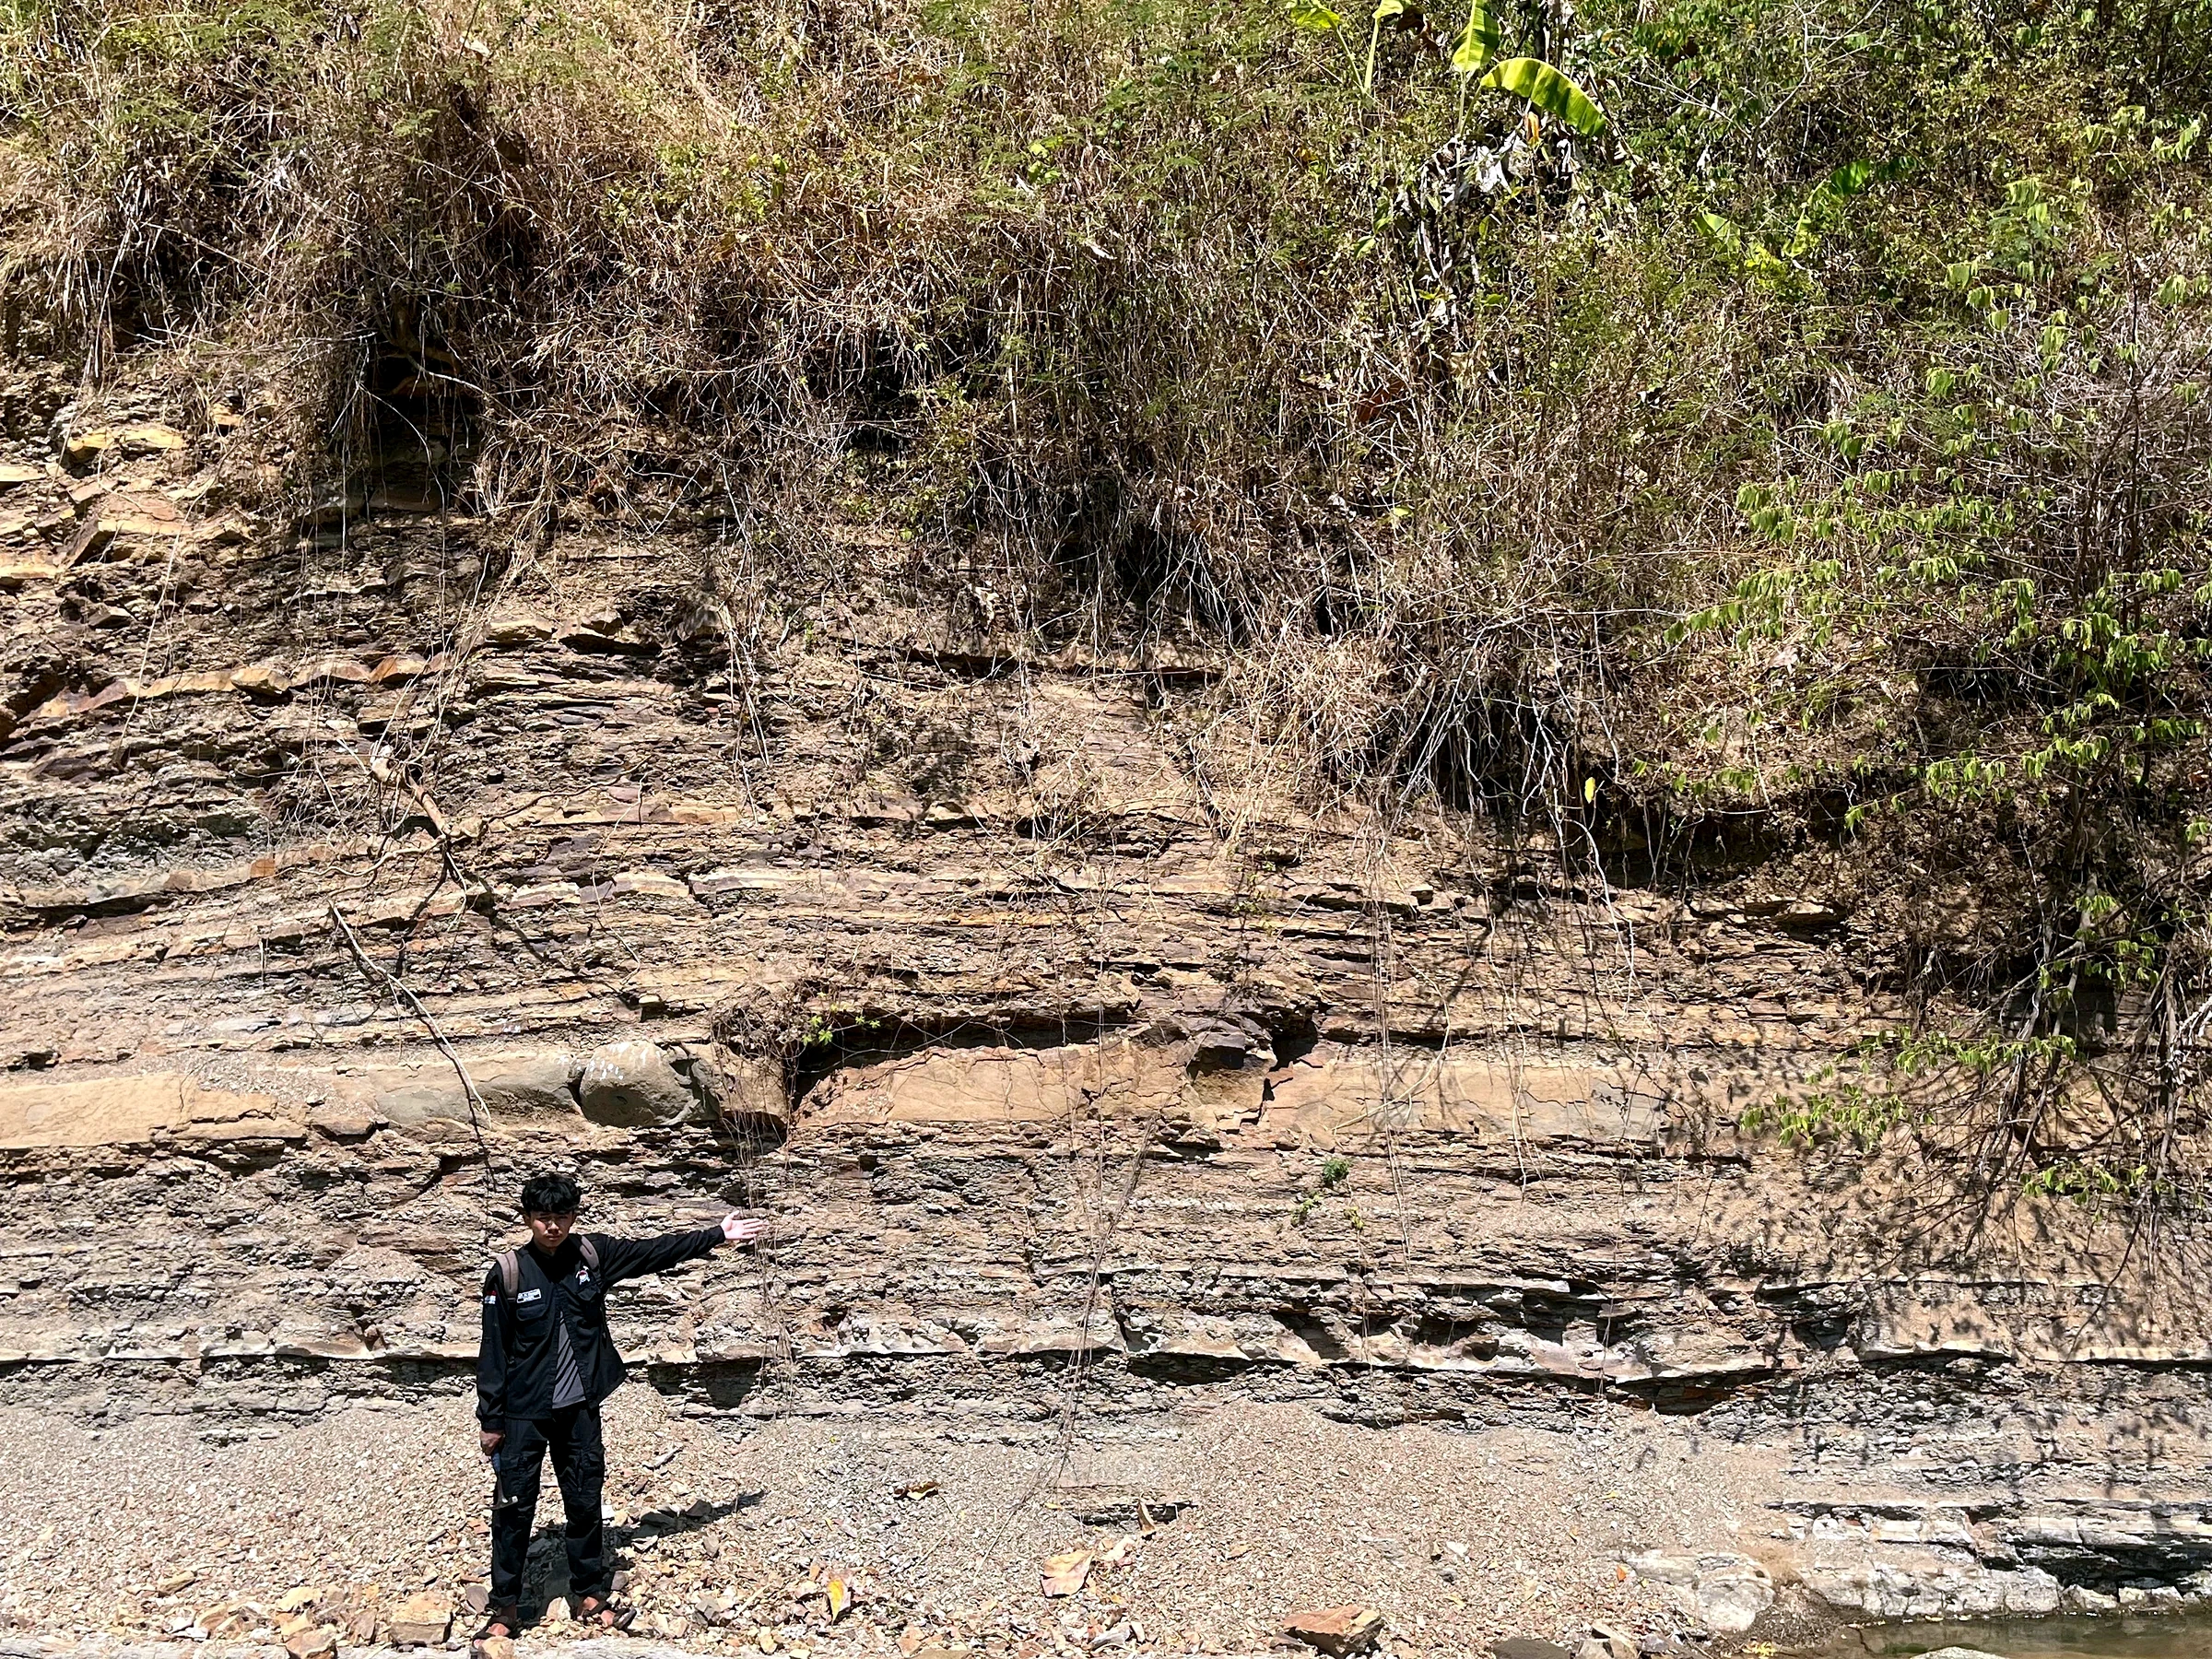
The Halang photographs show repeated sandstone ribs separated by more recessive clay-rich beds. At outcrop scale that alternation records repeated sediment-gravity-flow deposition and suspension fallout; it also creates the competence contrast that governs later folding, jointing, weathering and bedding-parallel slip. The source report uses sandstone proportion to suggest a middle-fan setting, but a fan element cannot be diagnosed from ratio alone because the same thin-bedded facies can occur in channel margins, lobes, overbank tracts or basin plain. Bed-by-bed thickness, grading, sole marks, lamination, amalgamation, lateral continuity and palaeocurrent direction are the deciding observations. These frames establish the Halang host architecture; they do not add independent fault planes where none are visible.
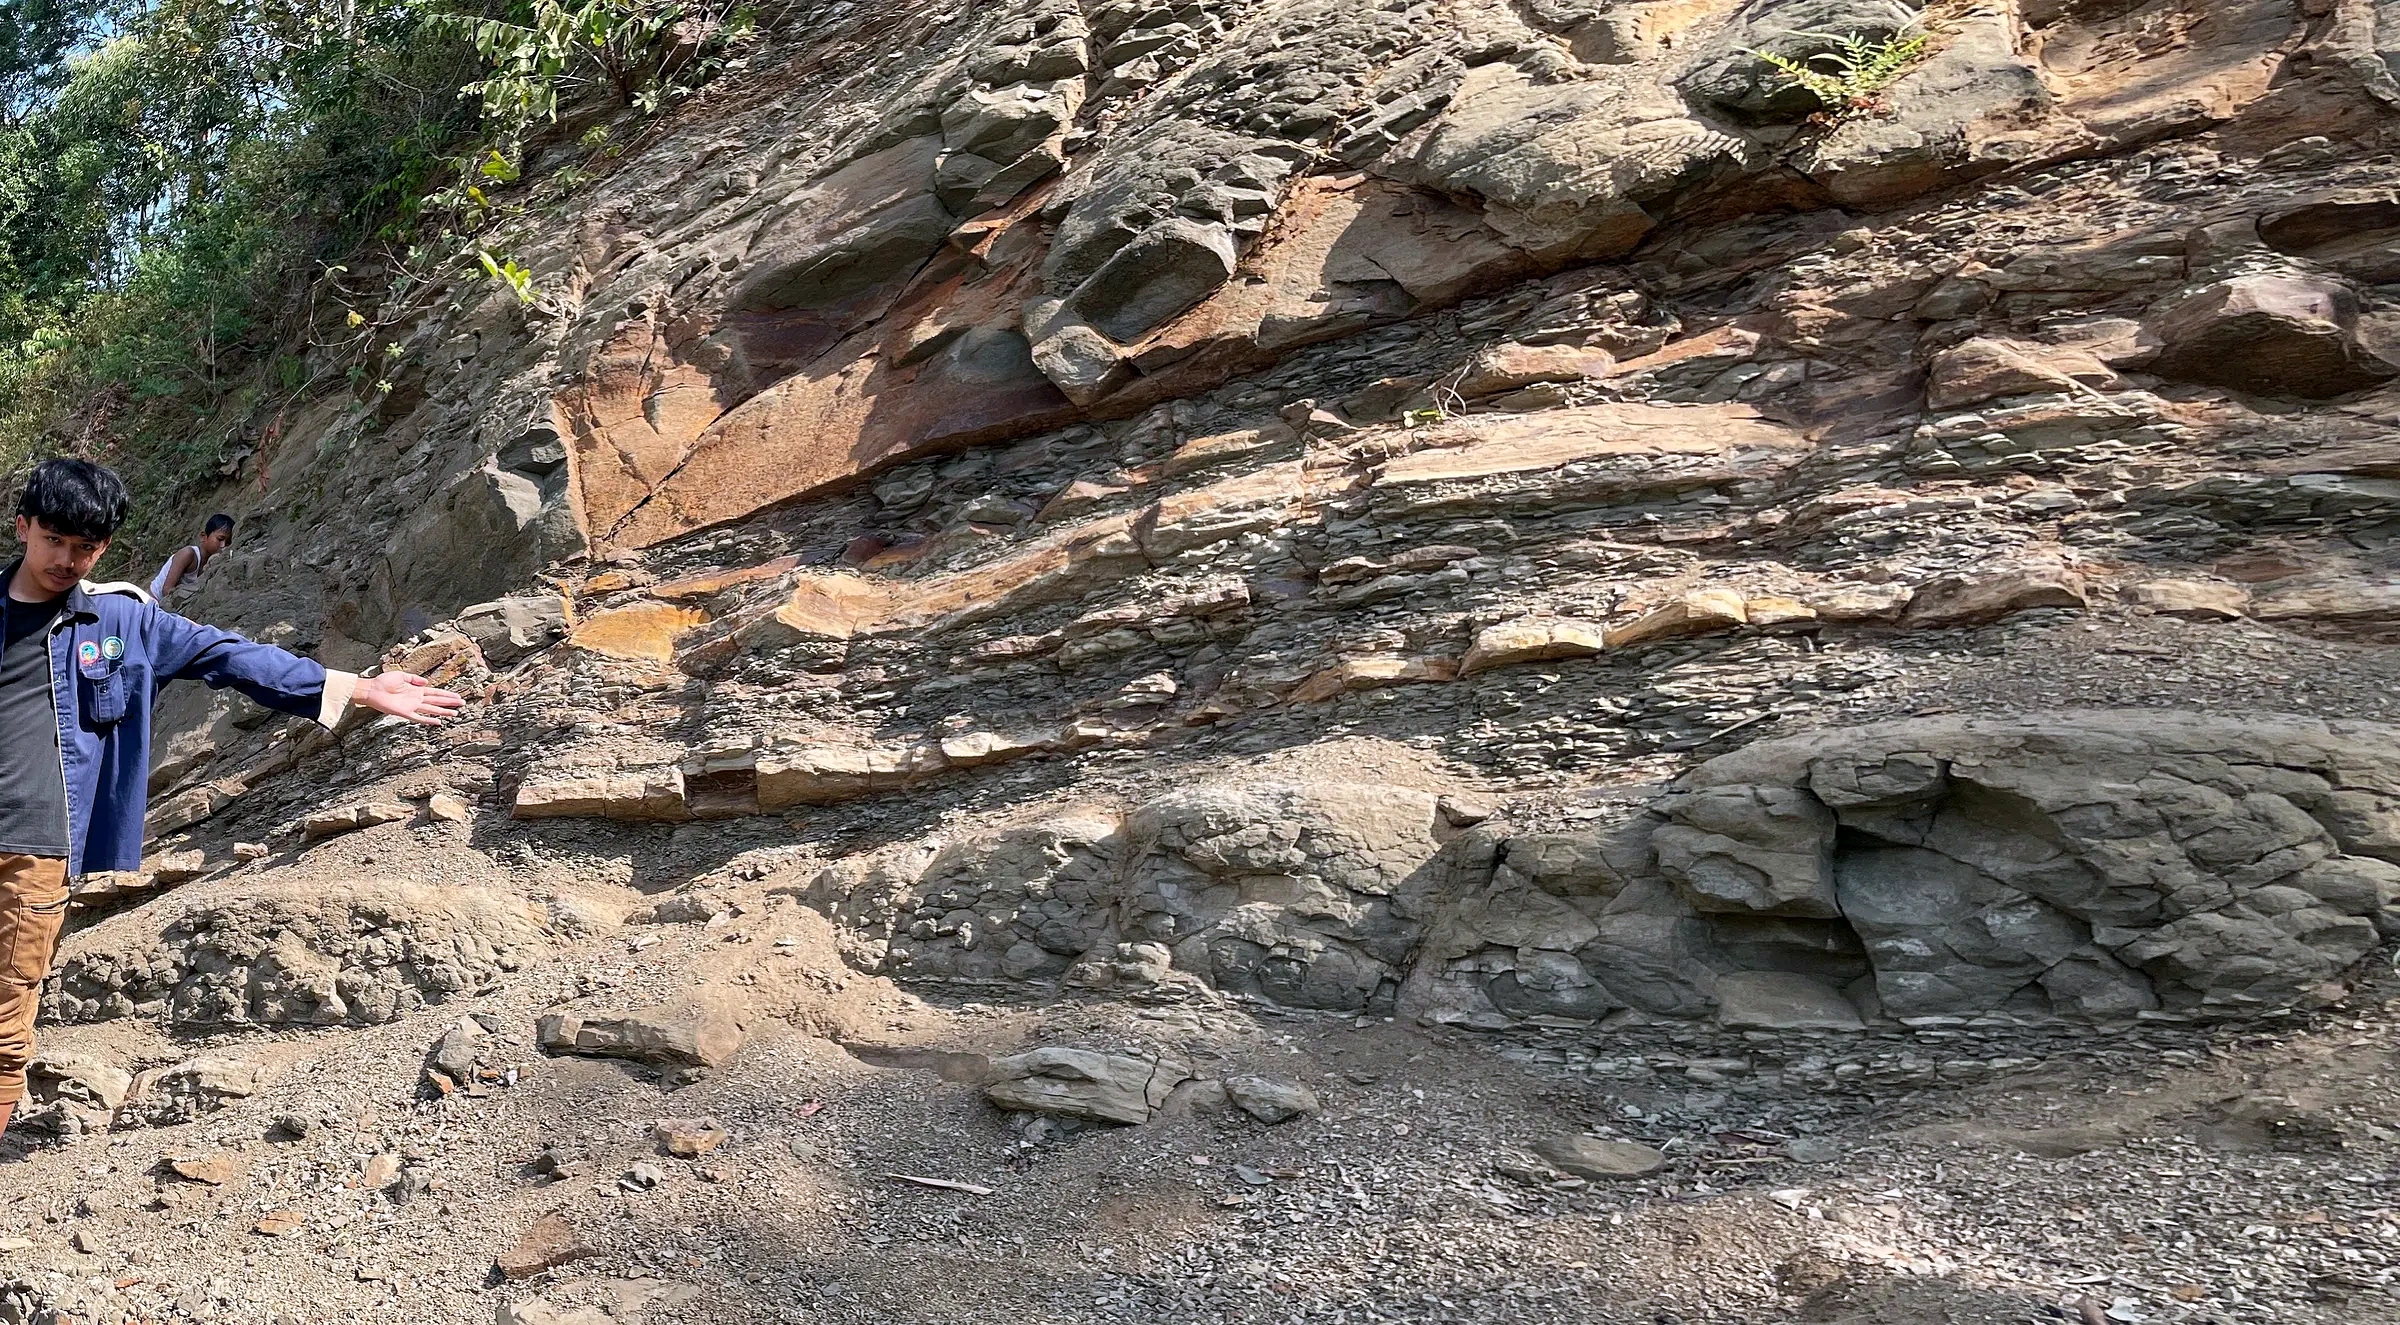
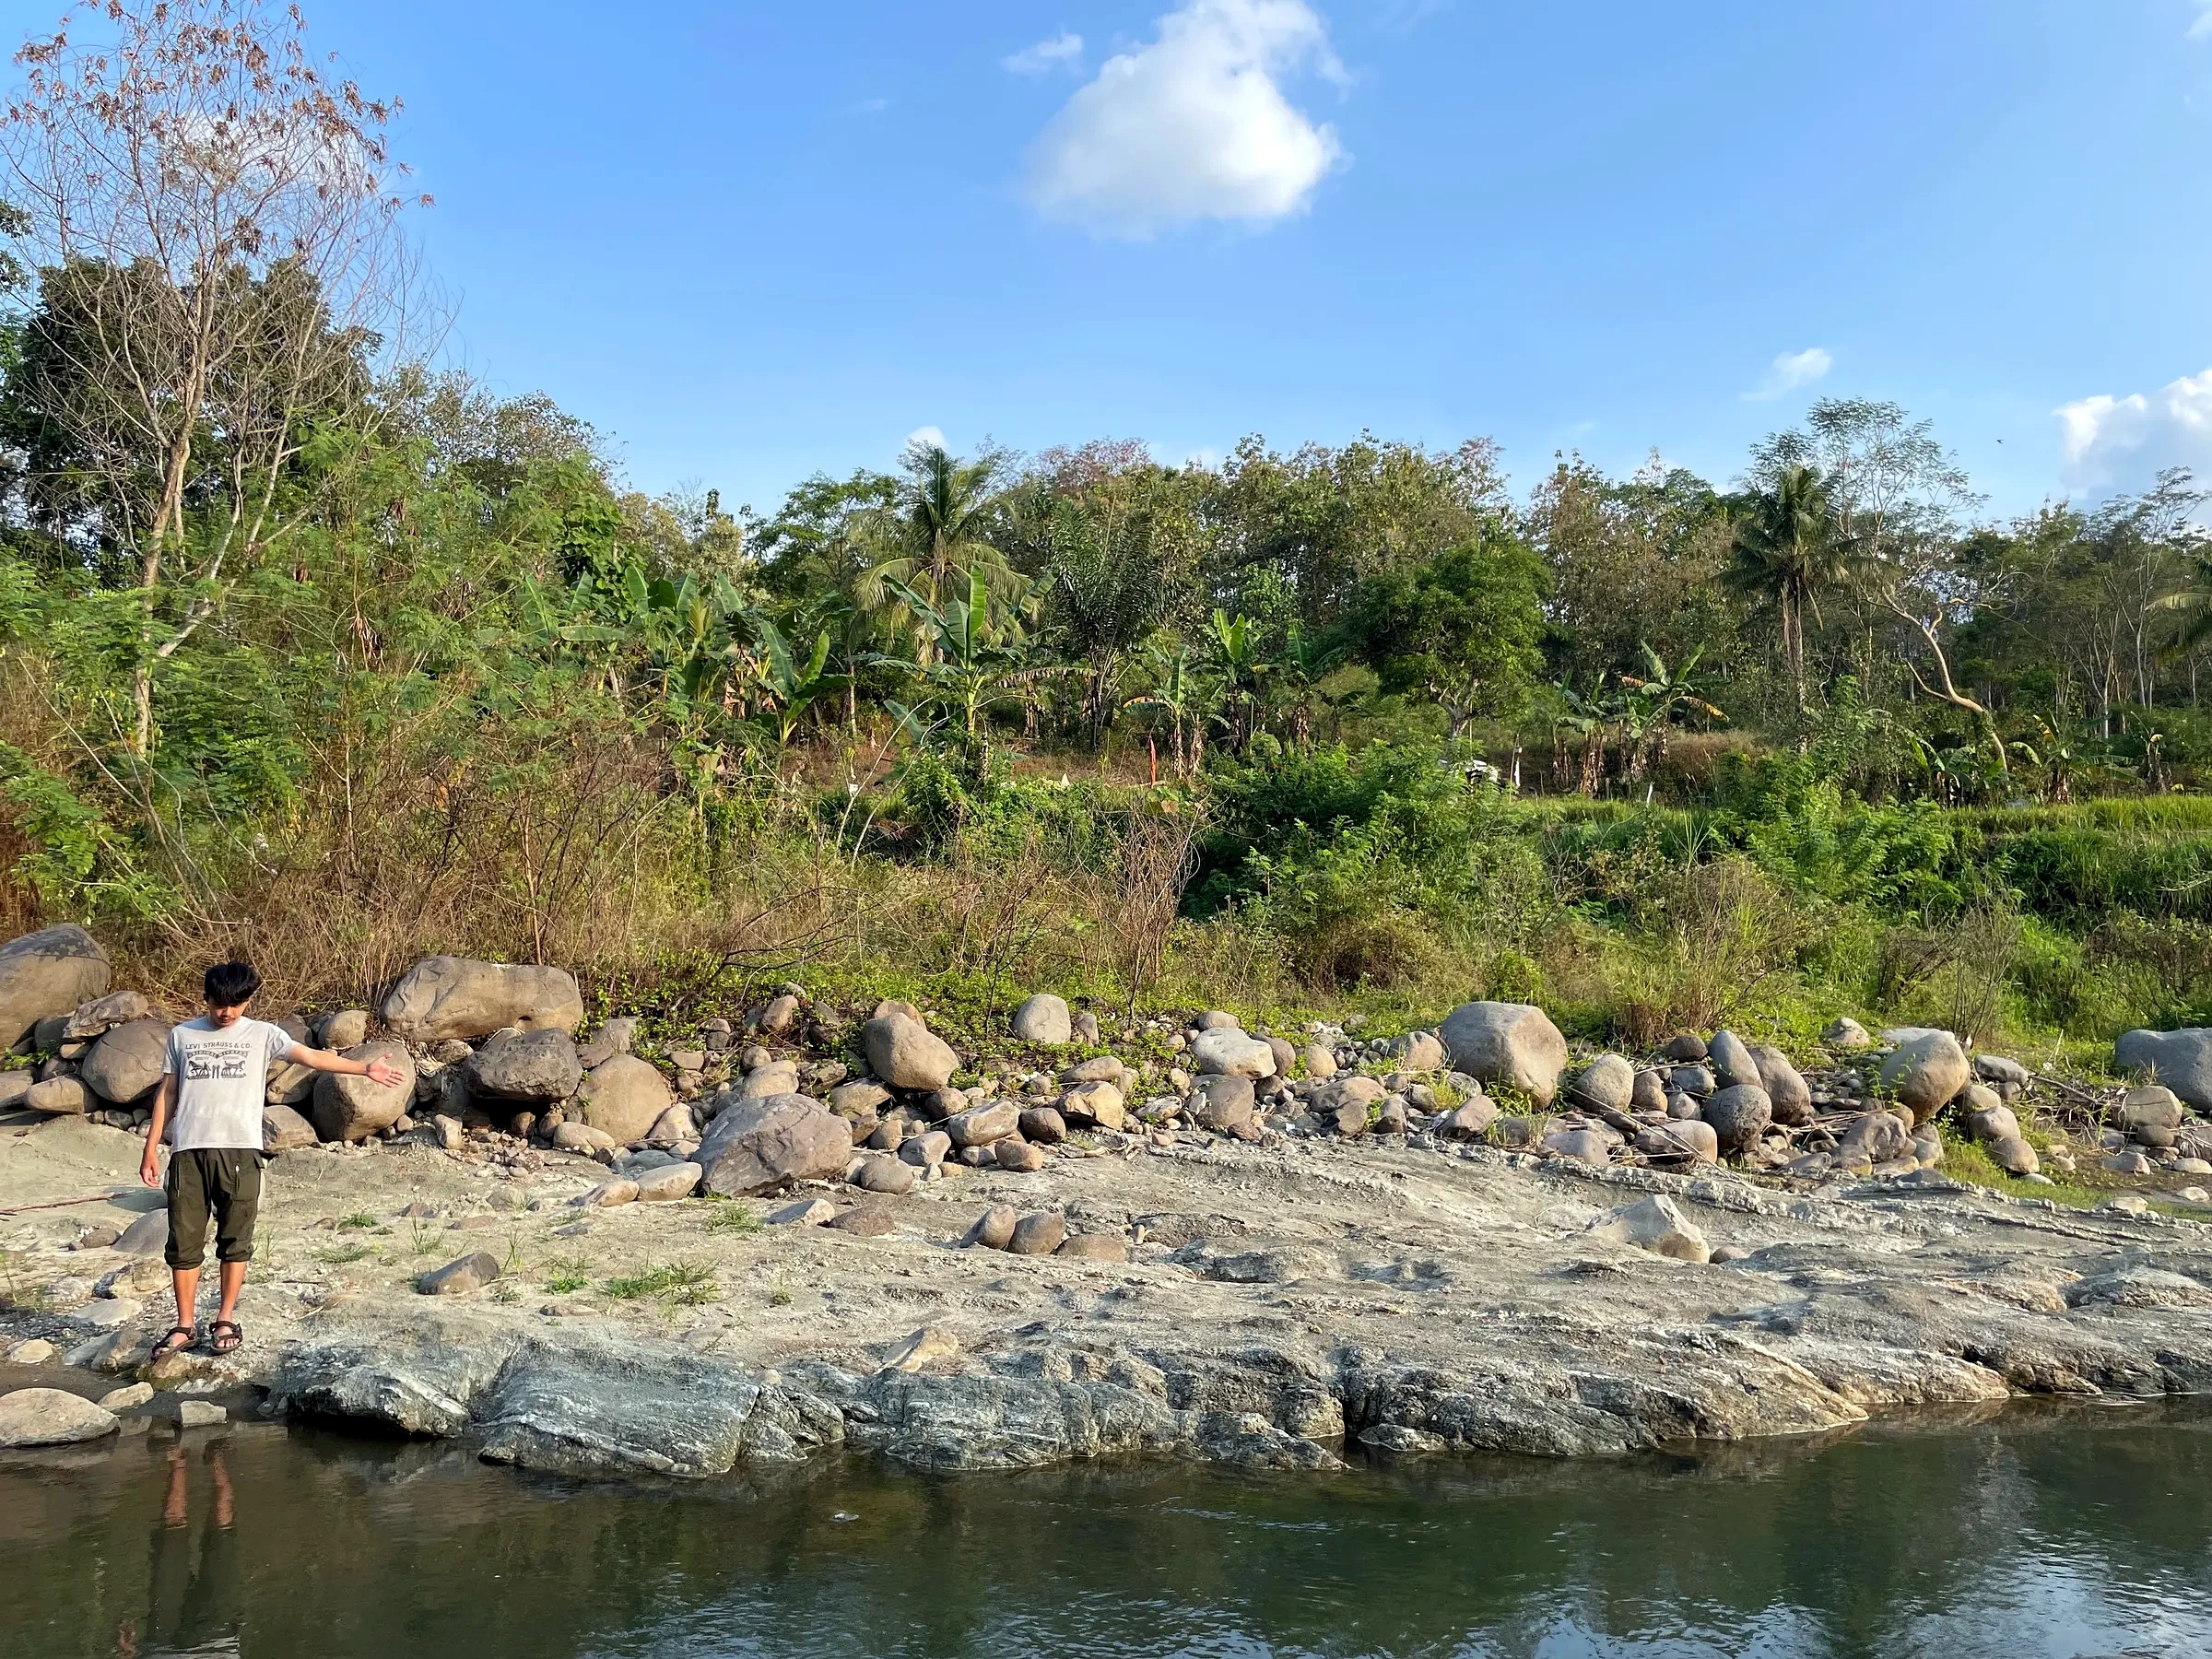
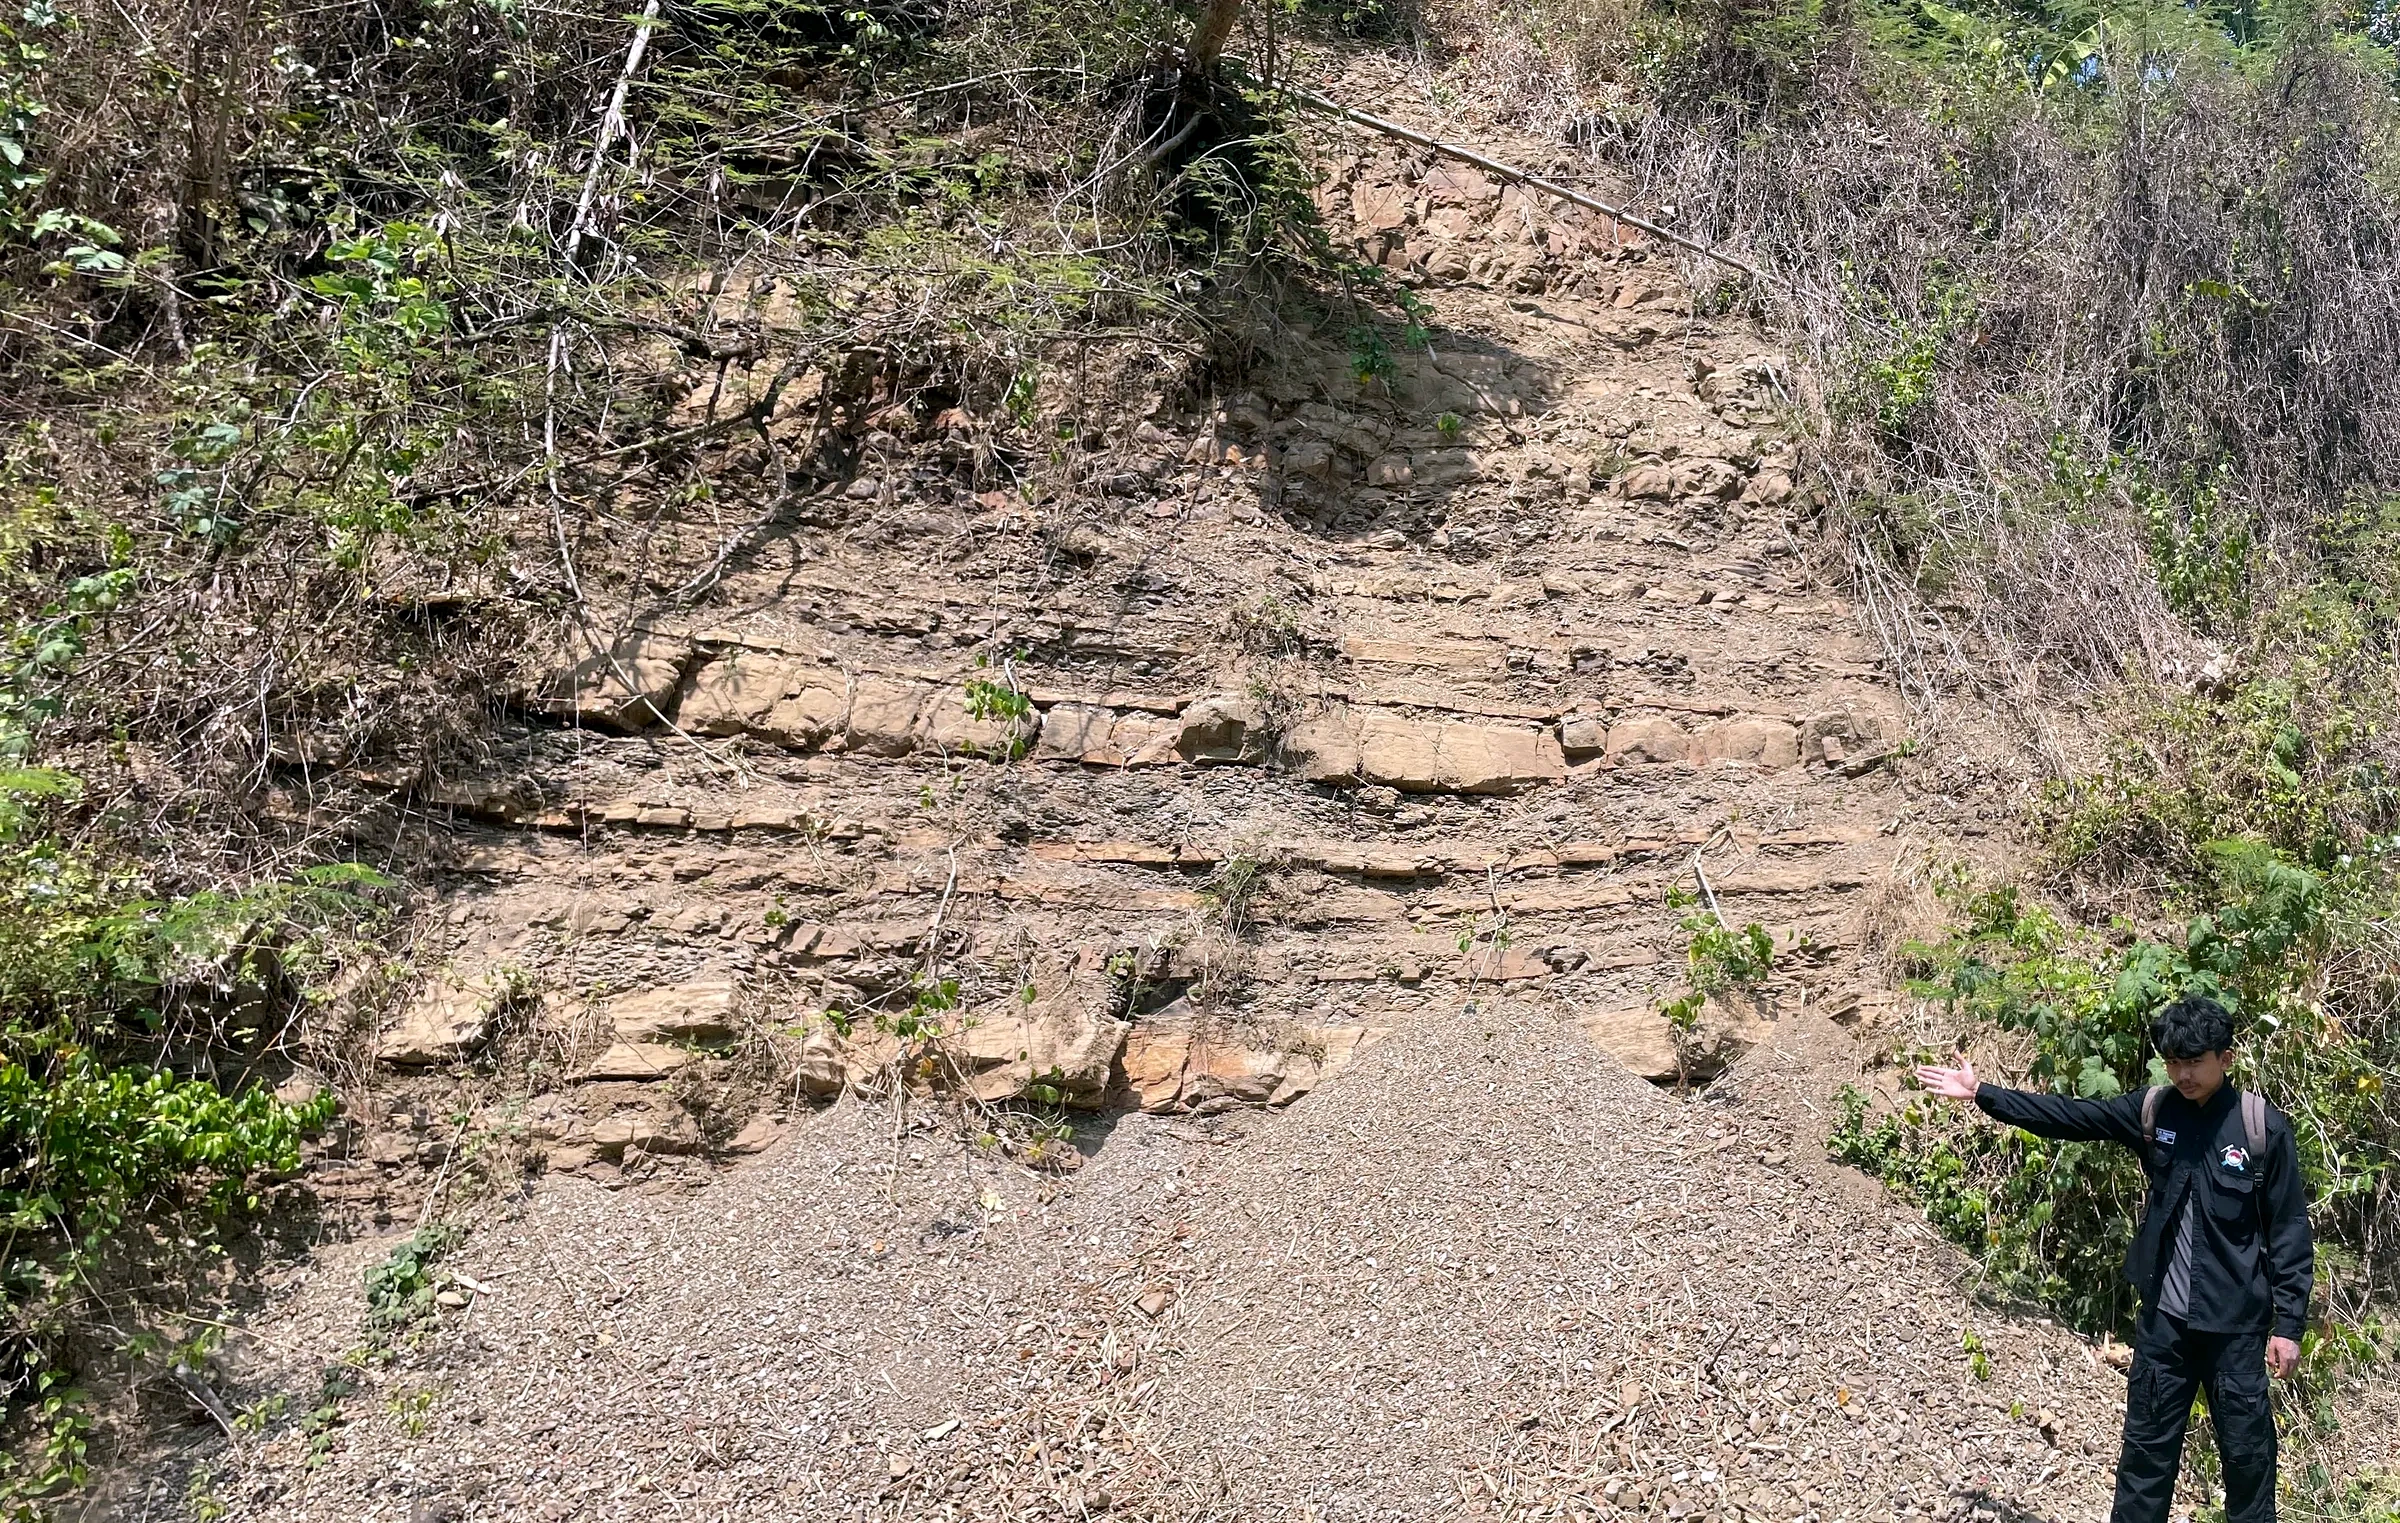
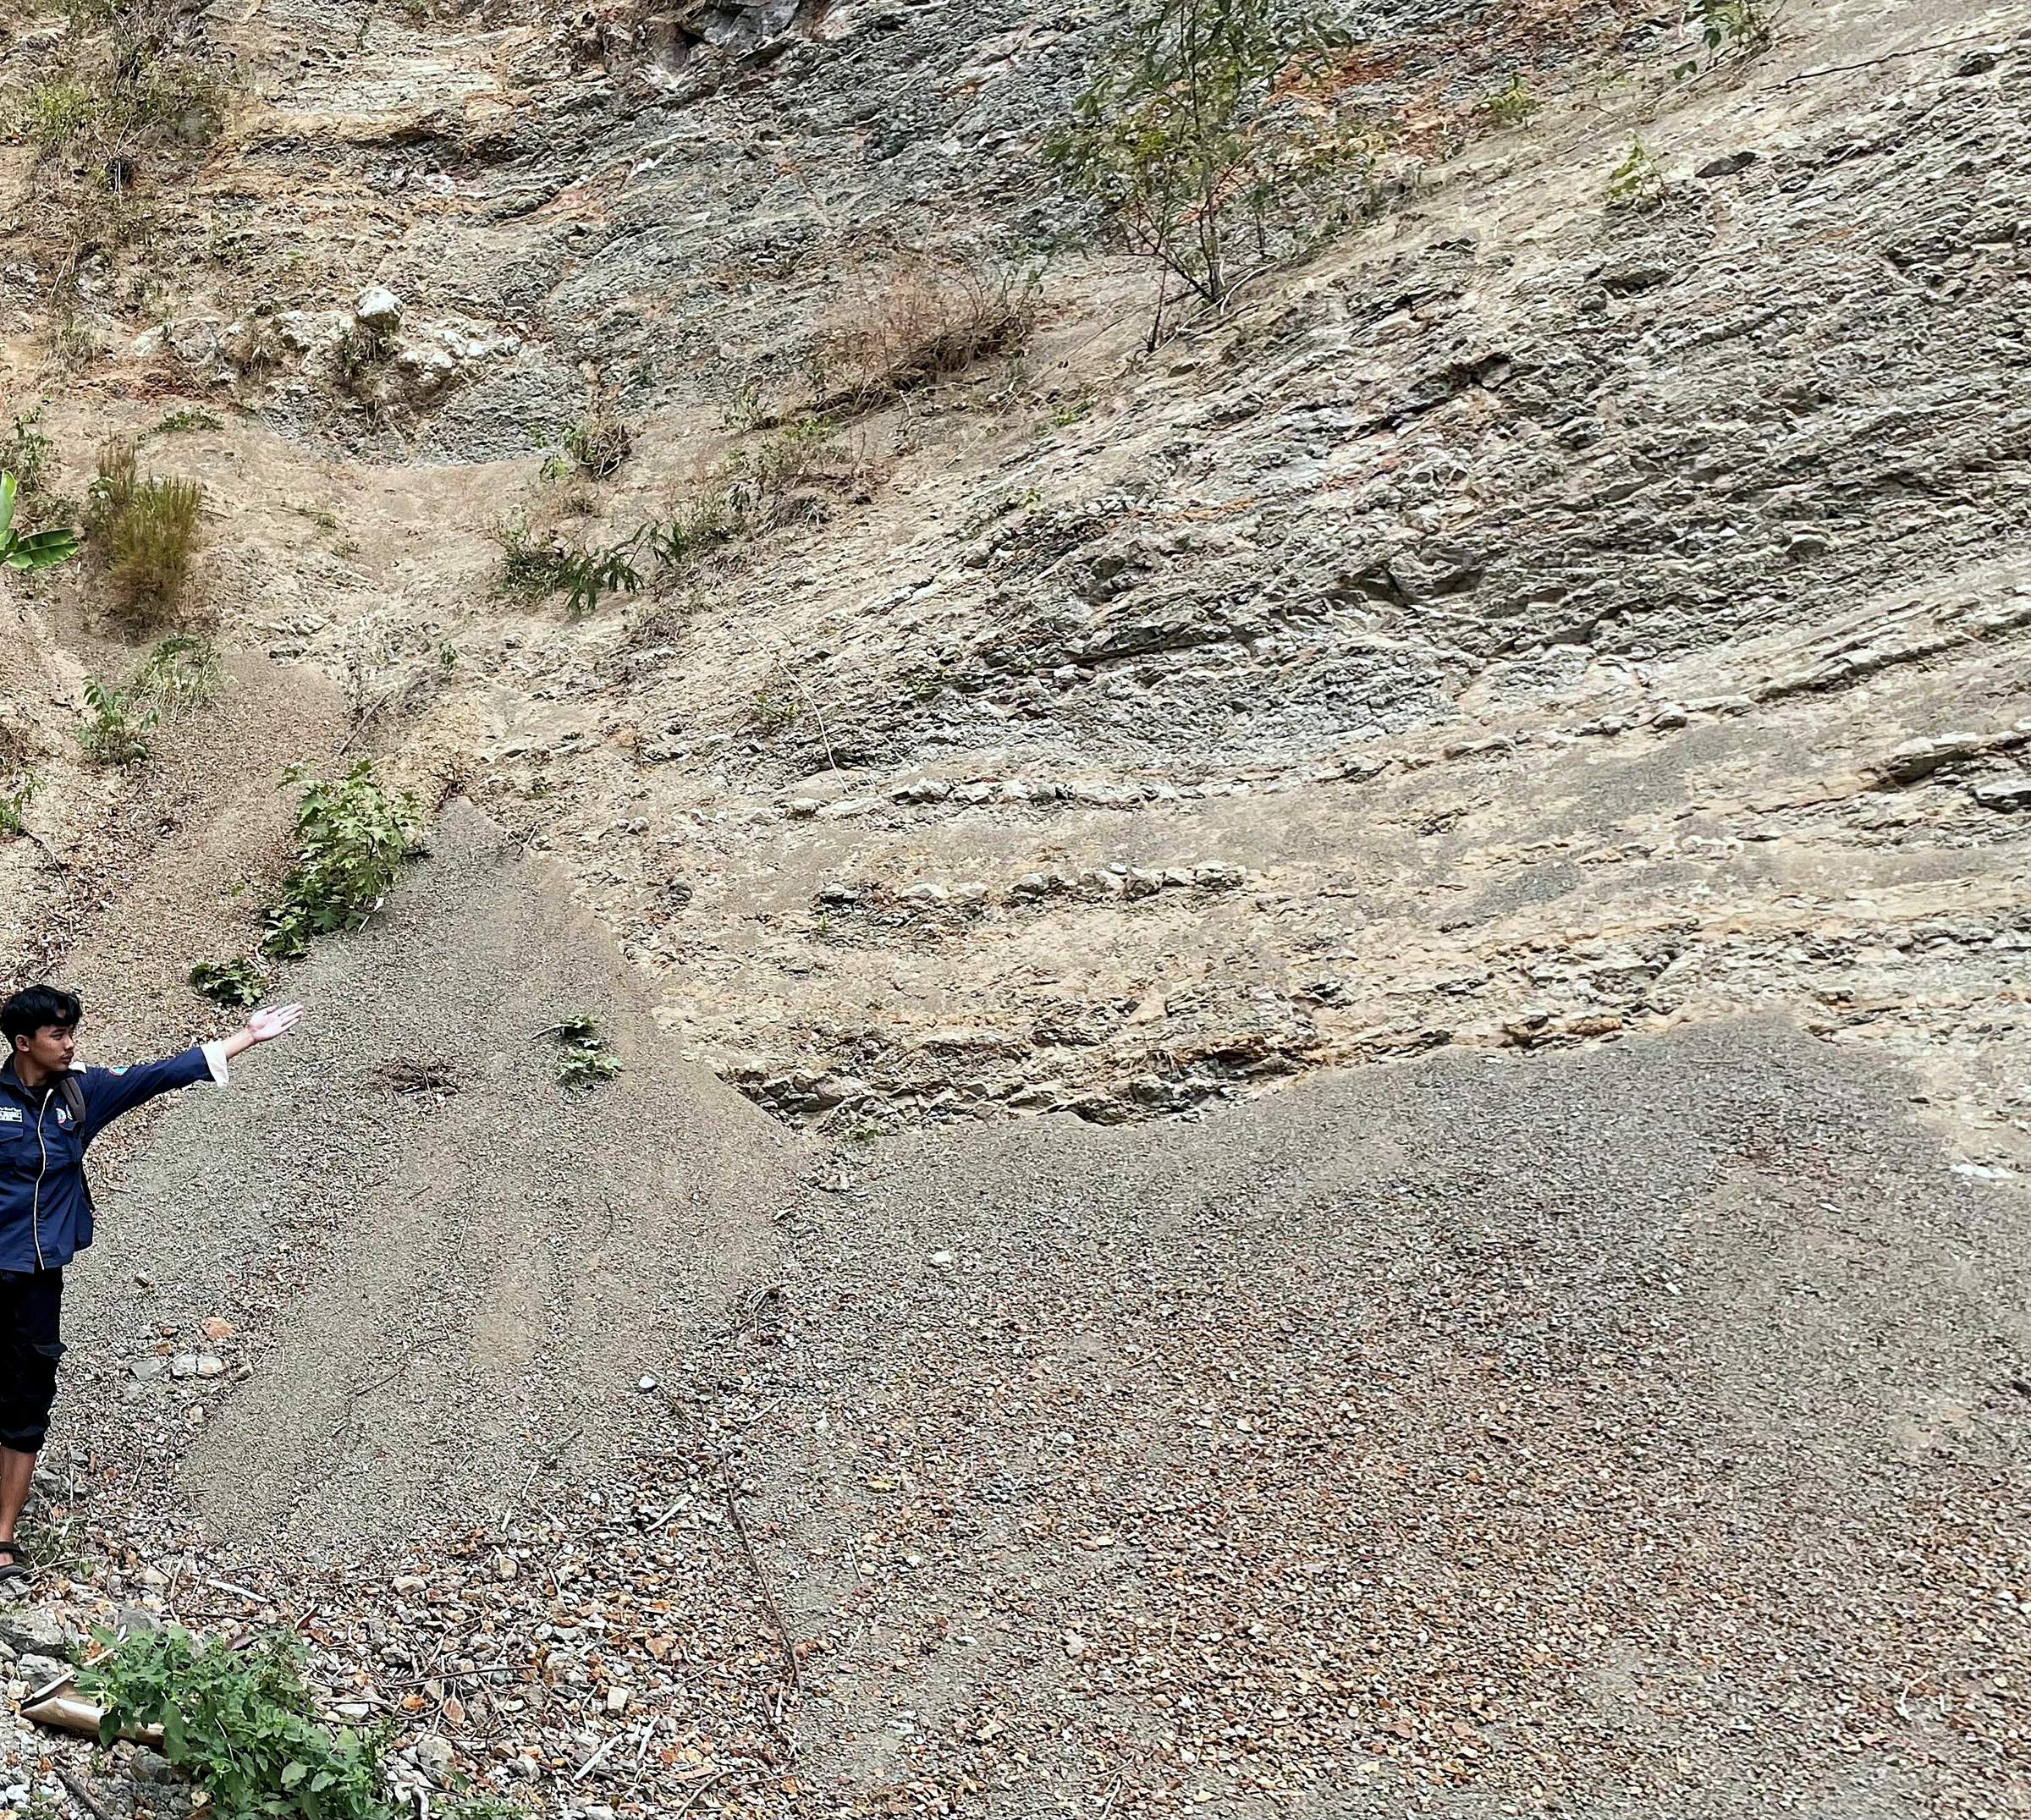
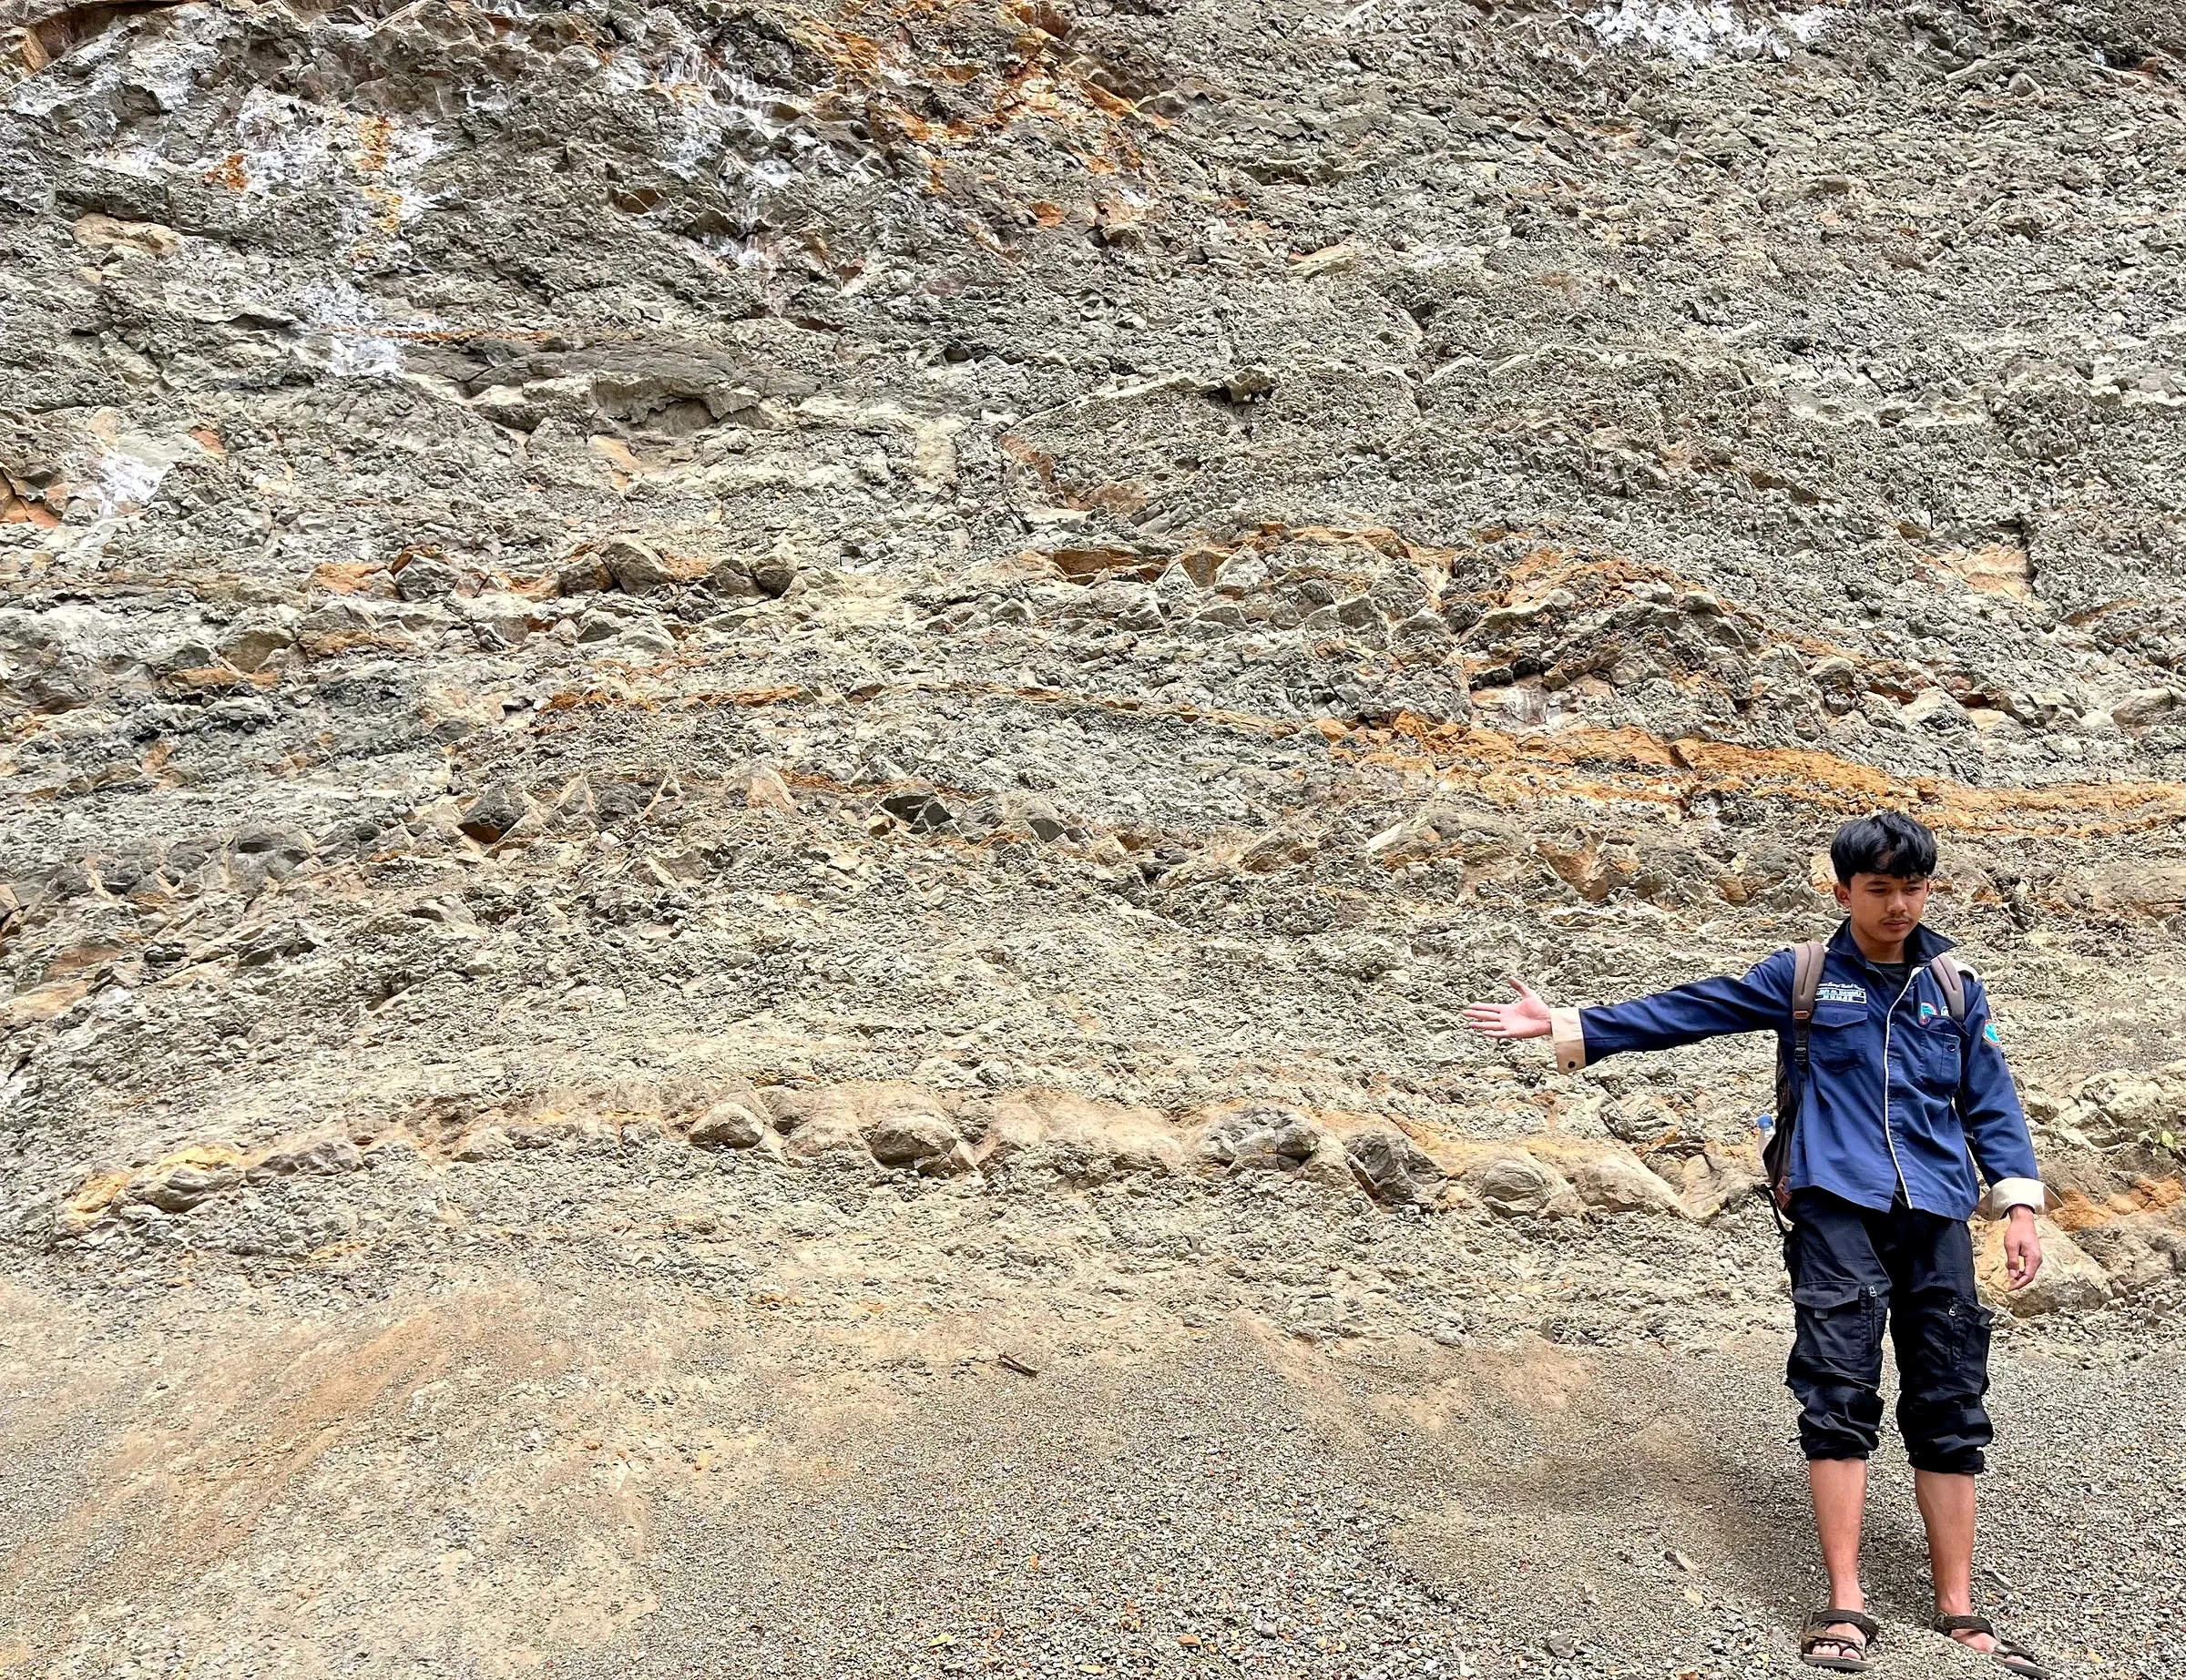
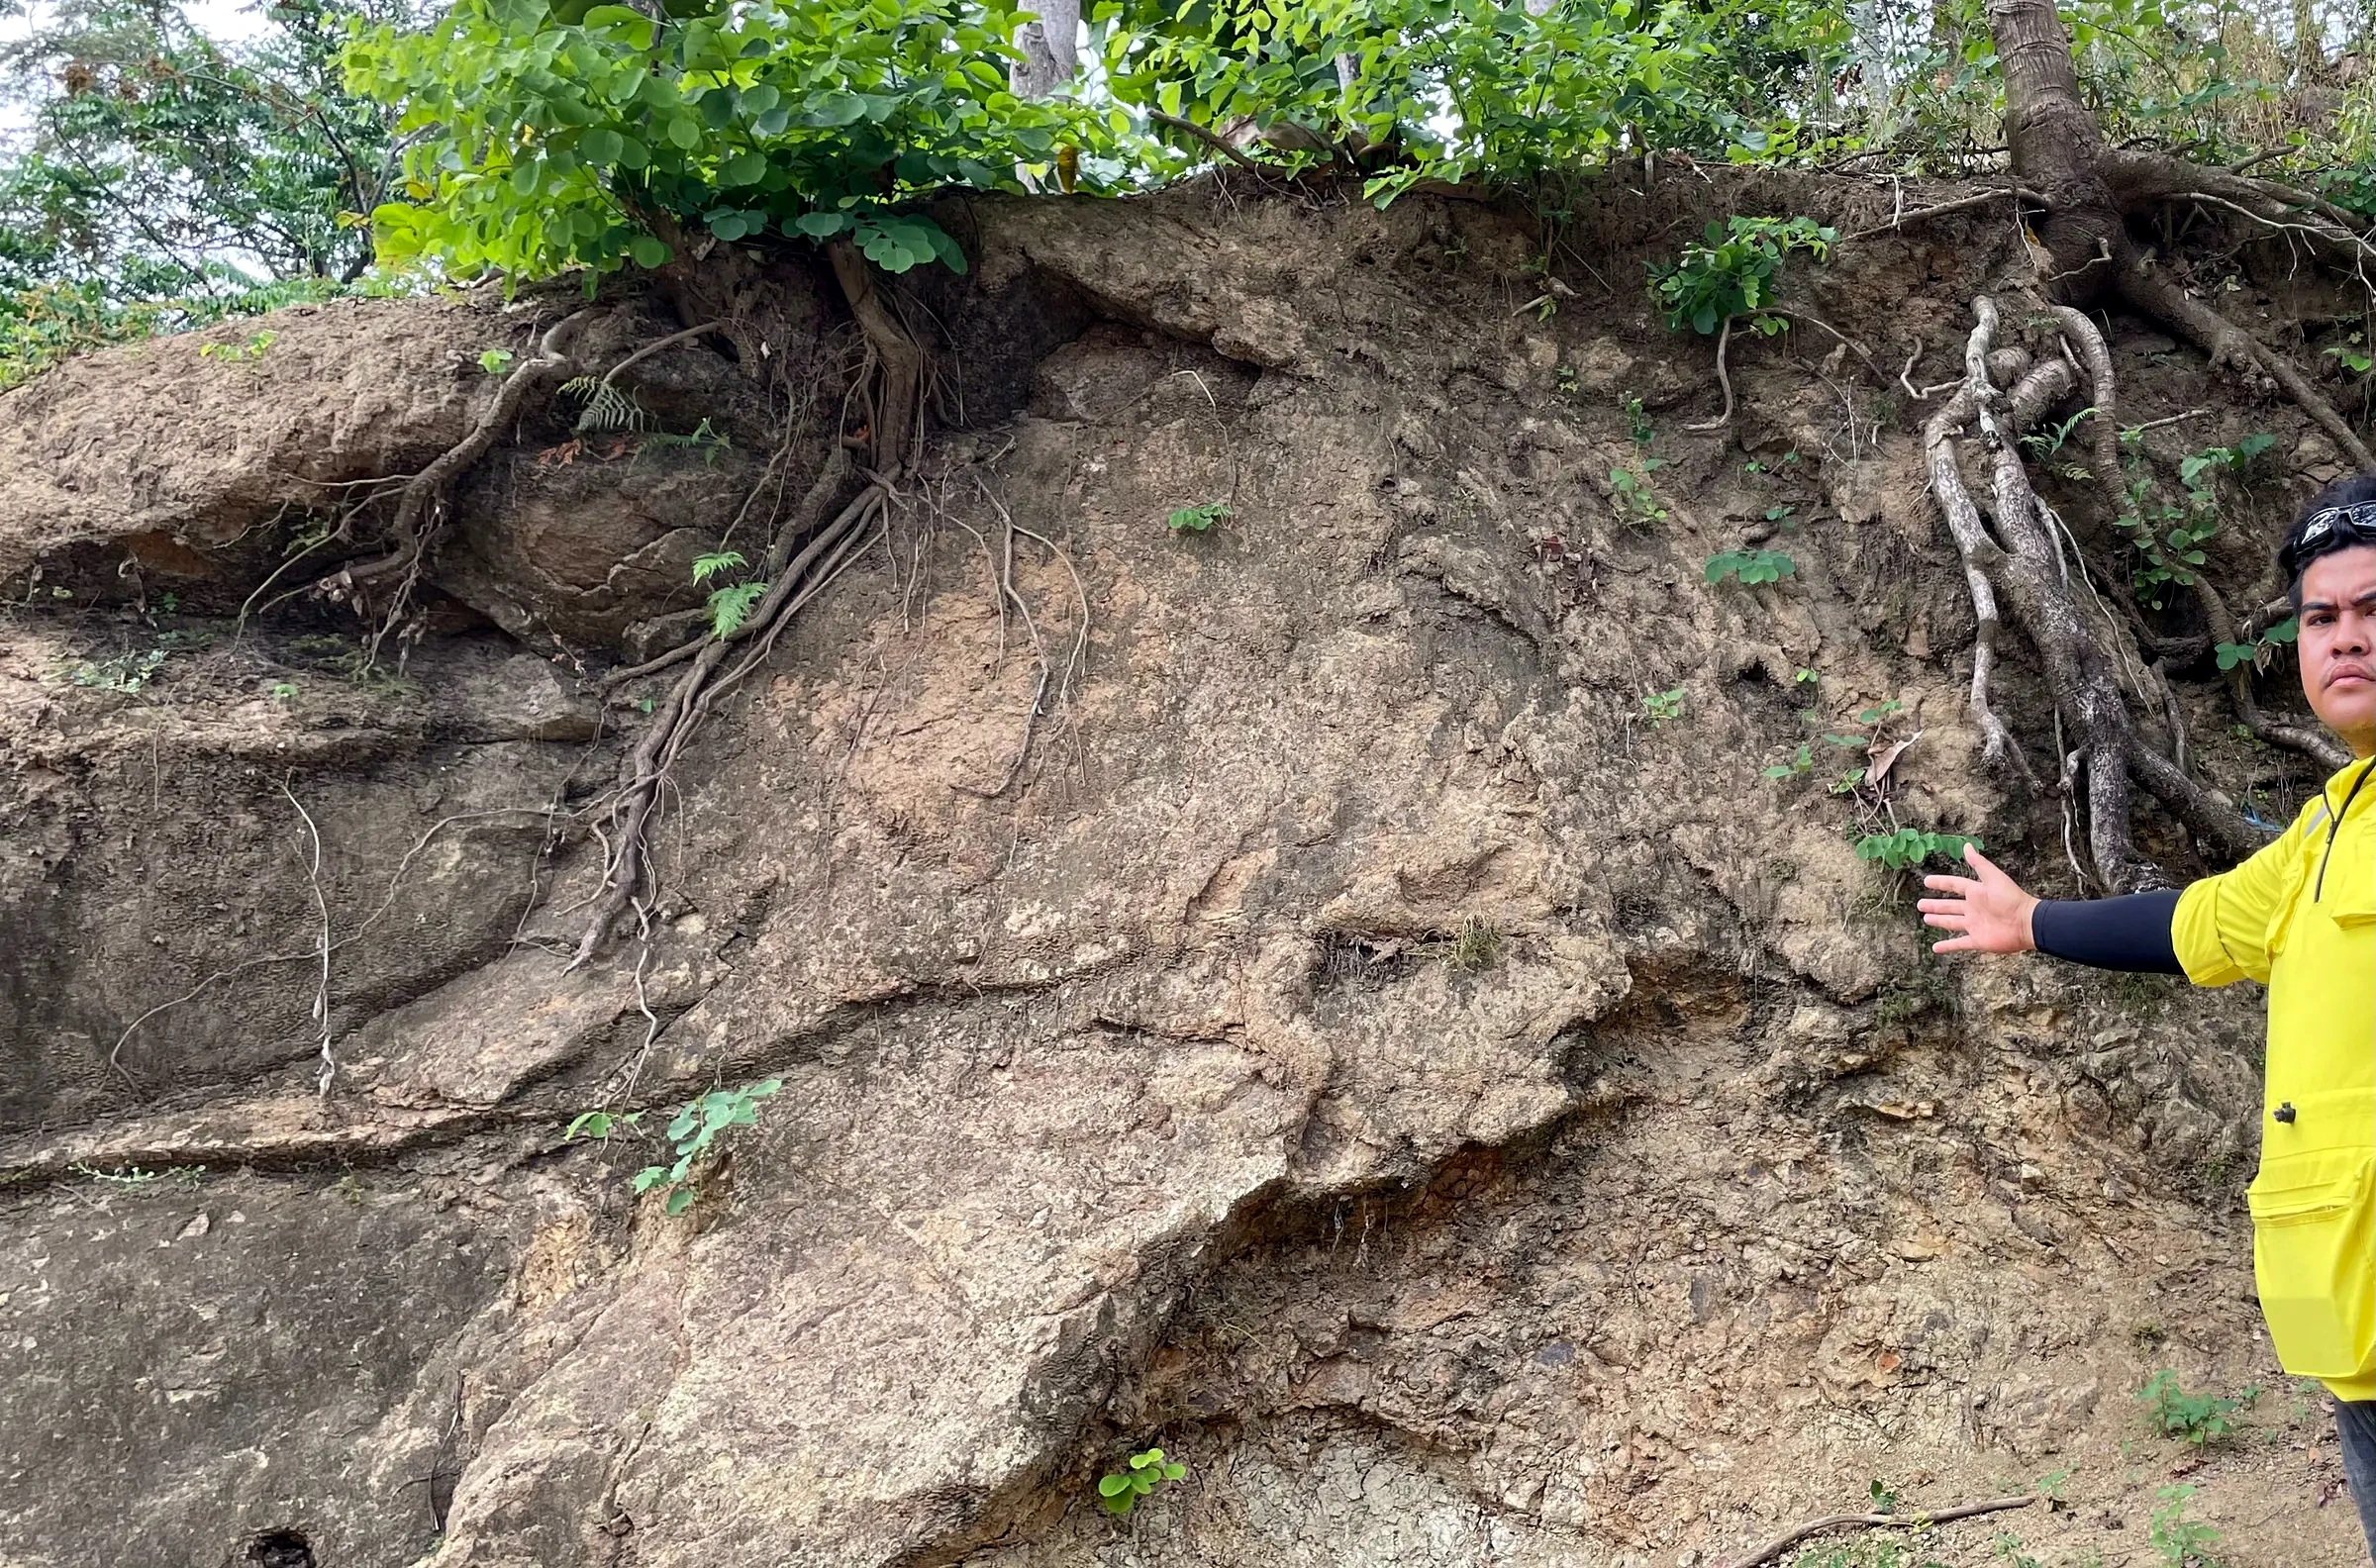
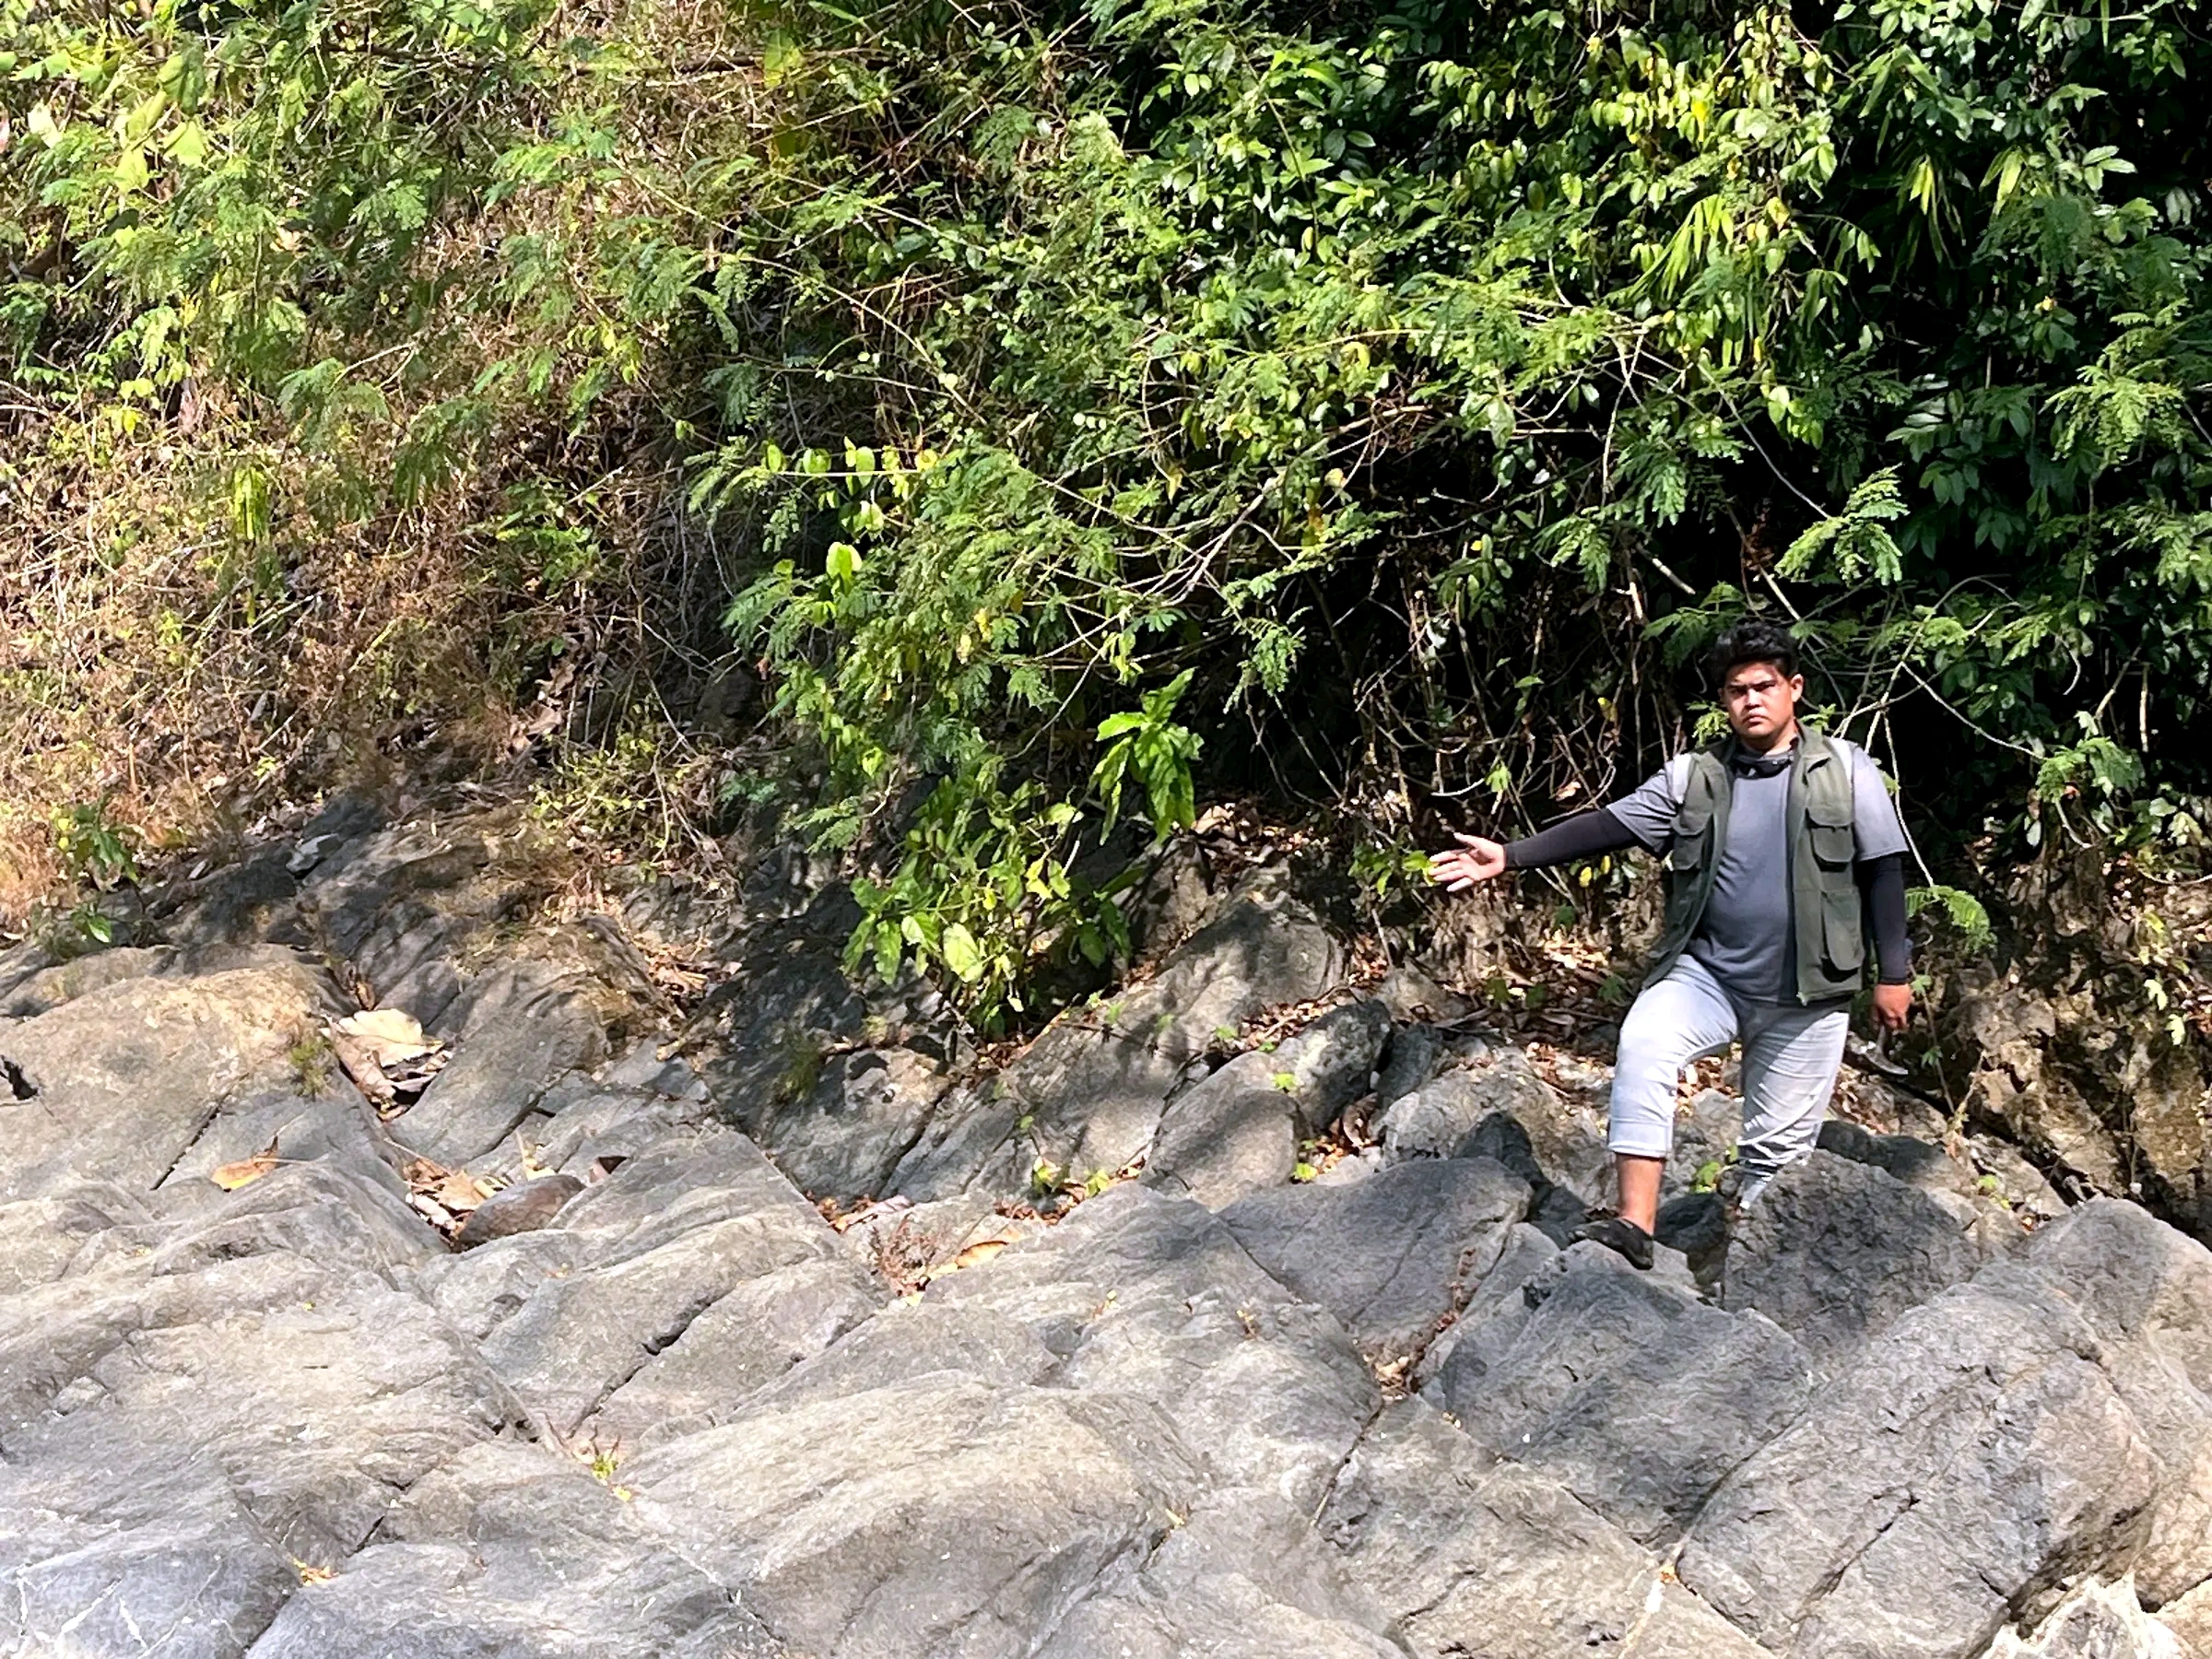
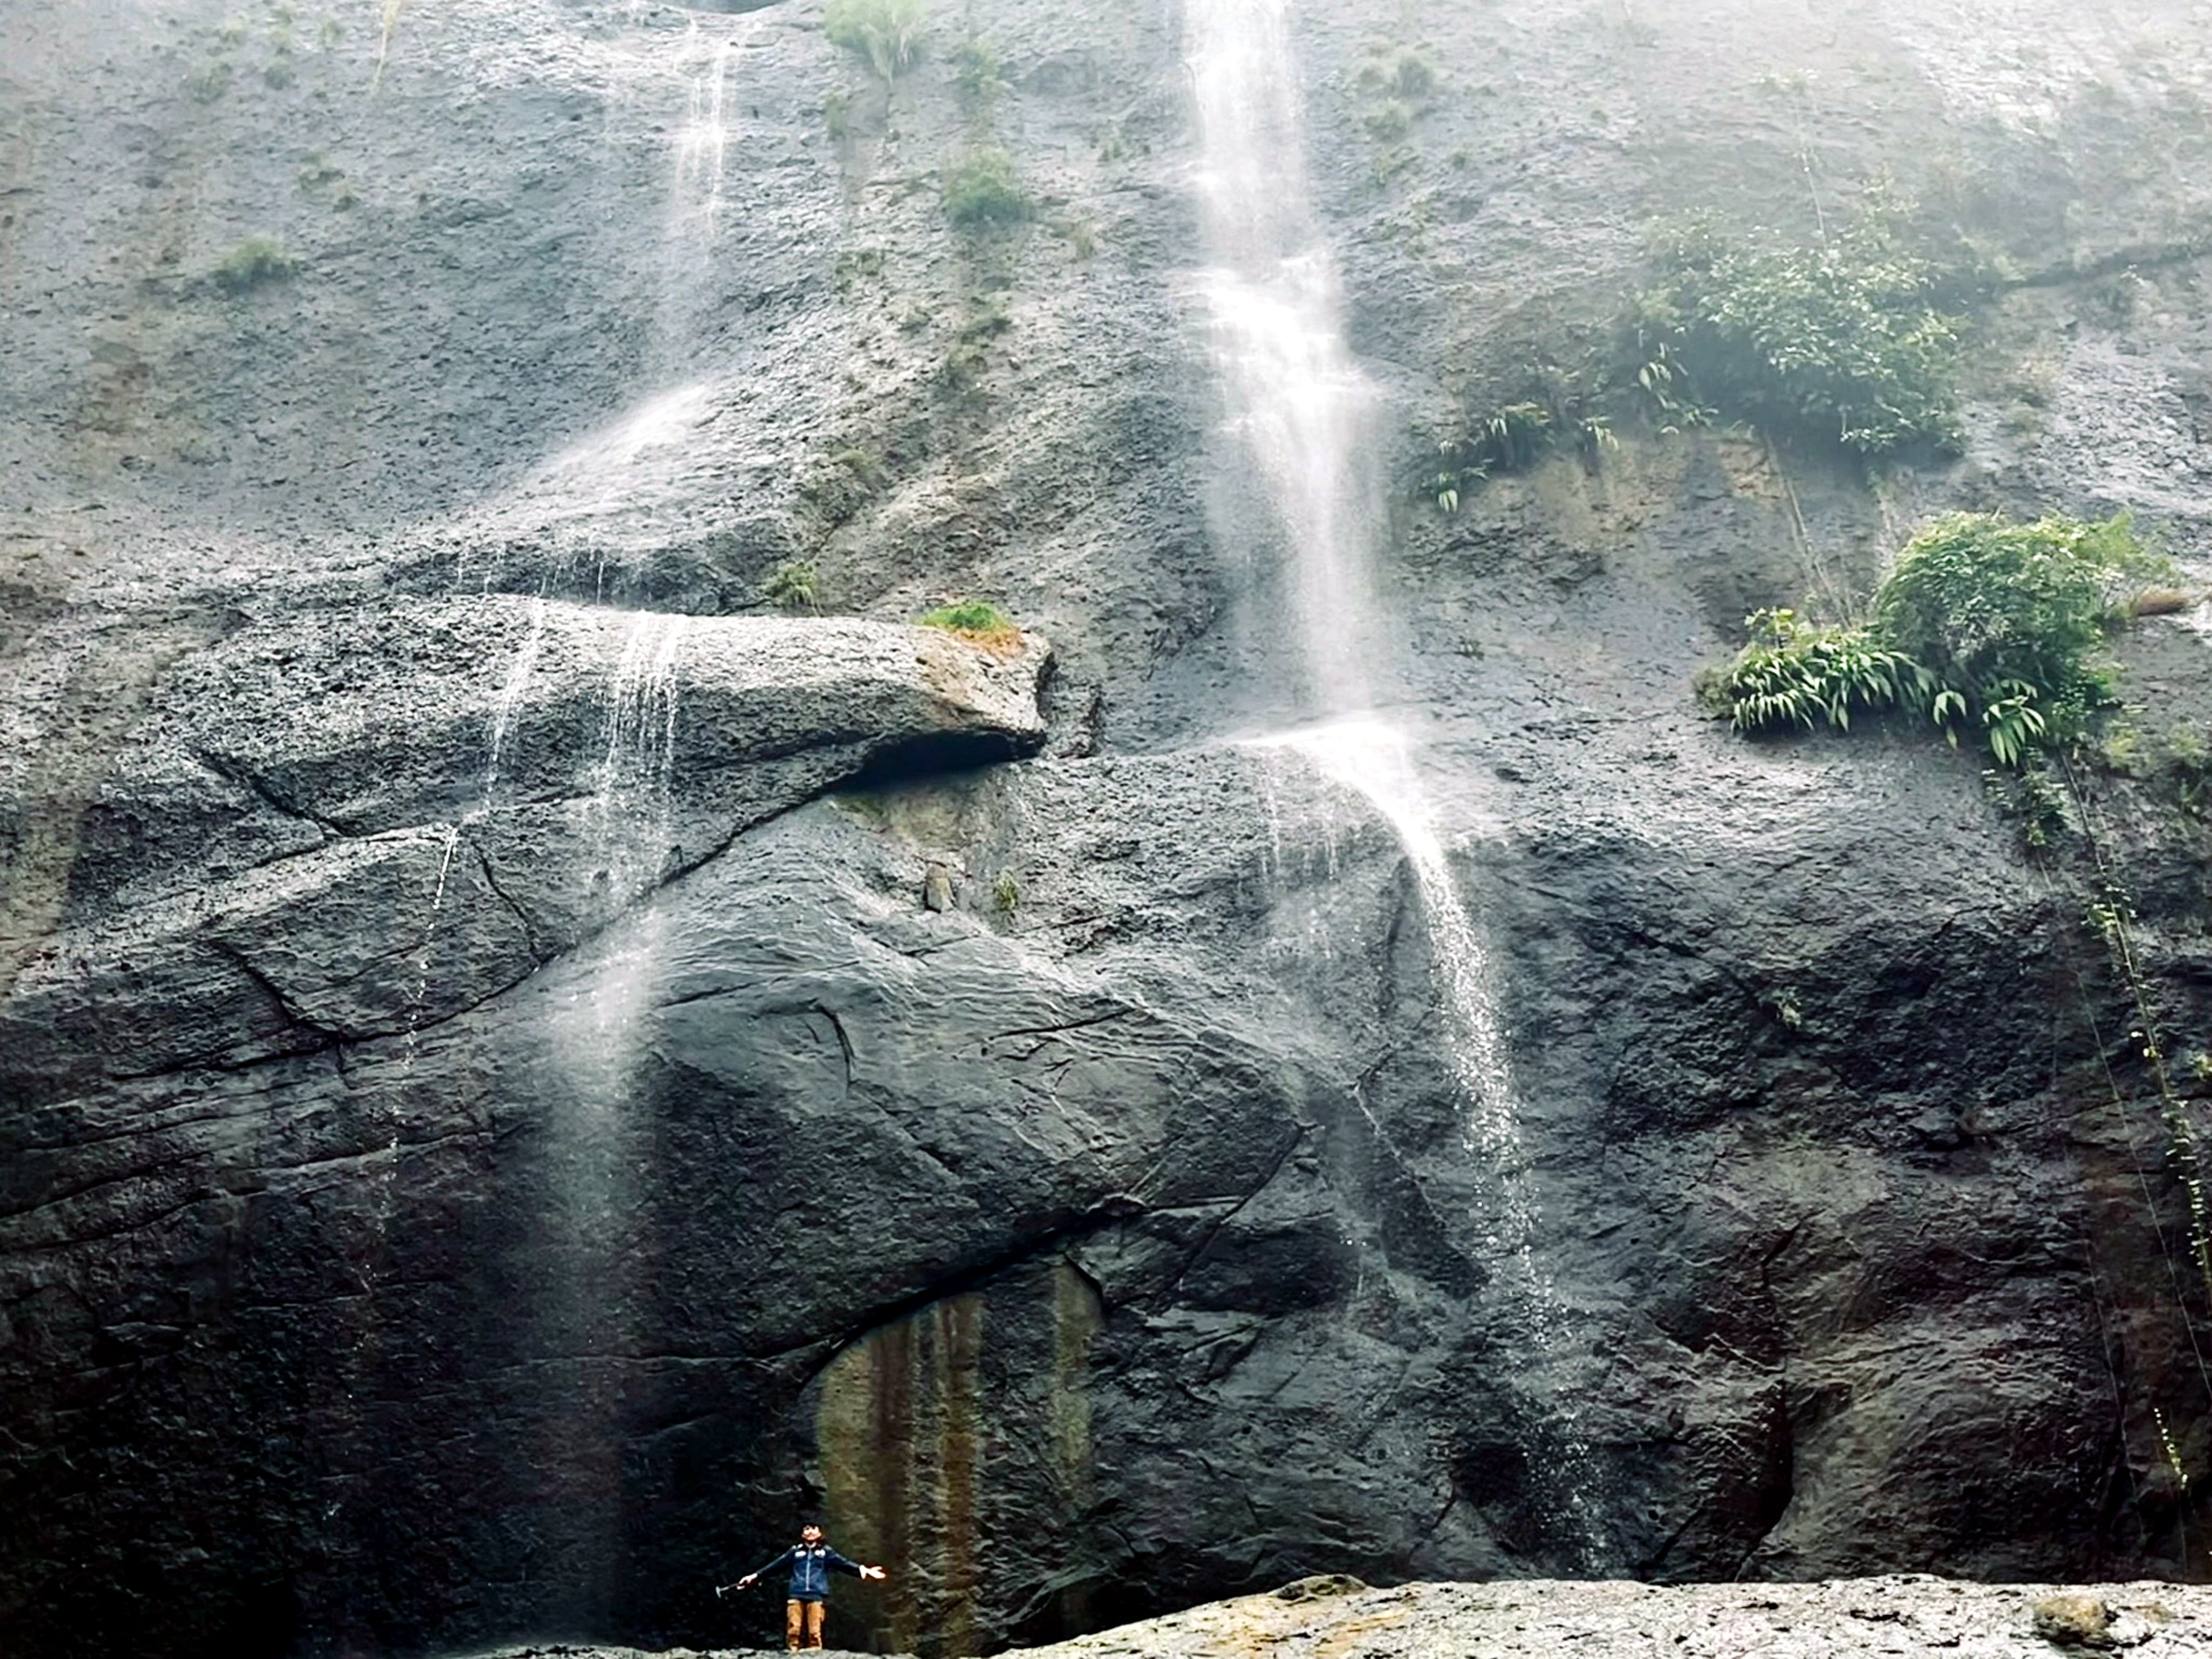
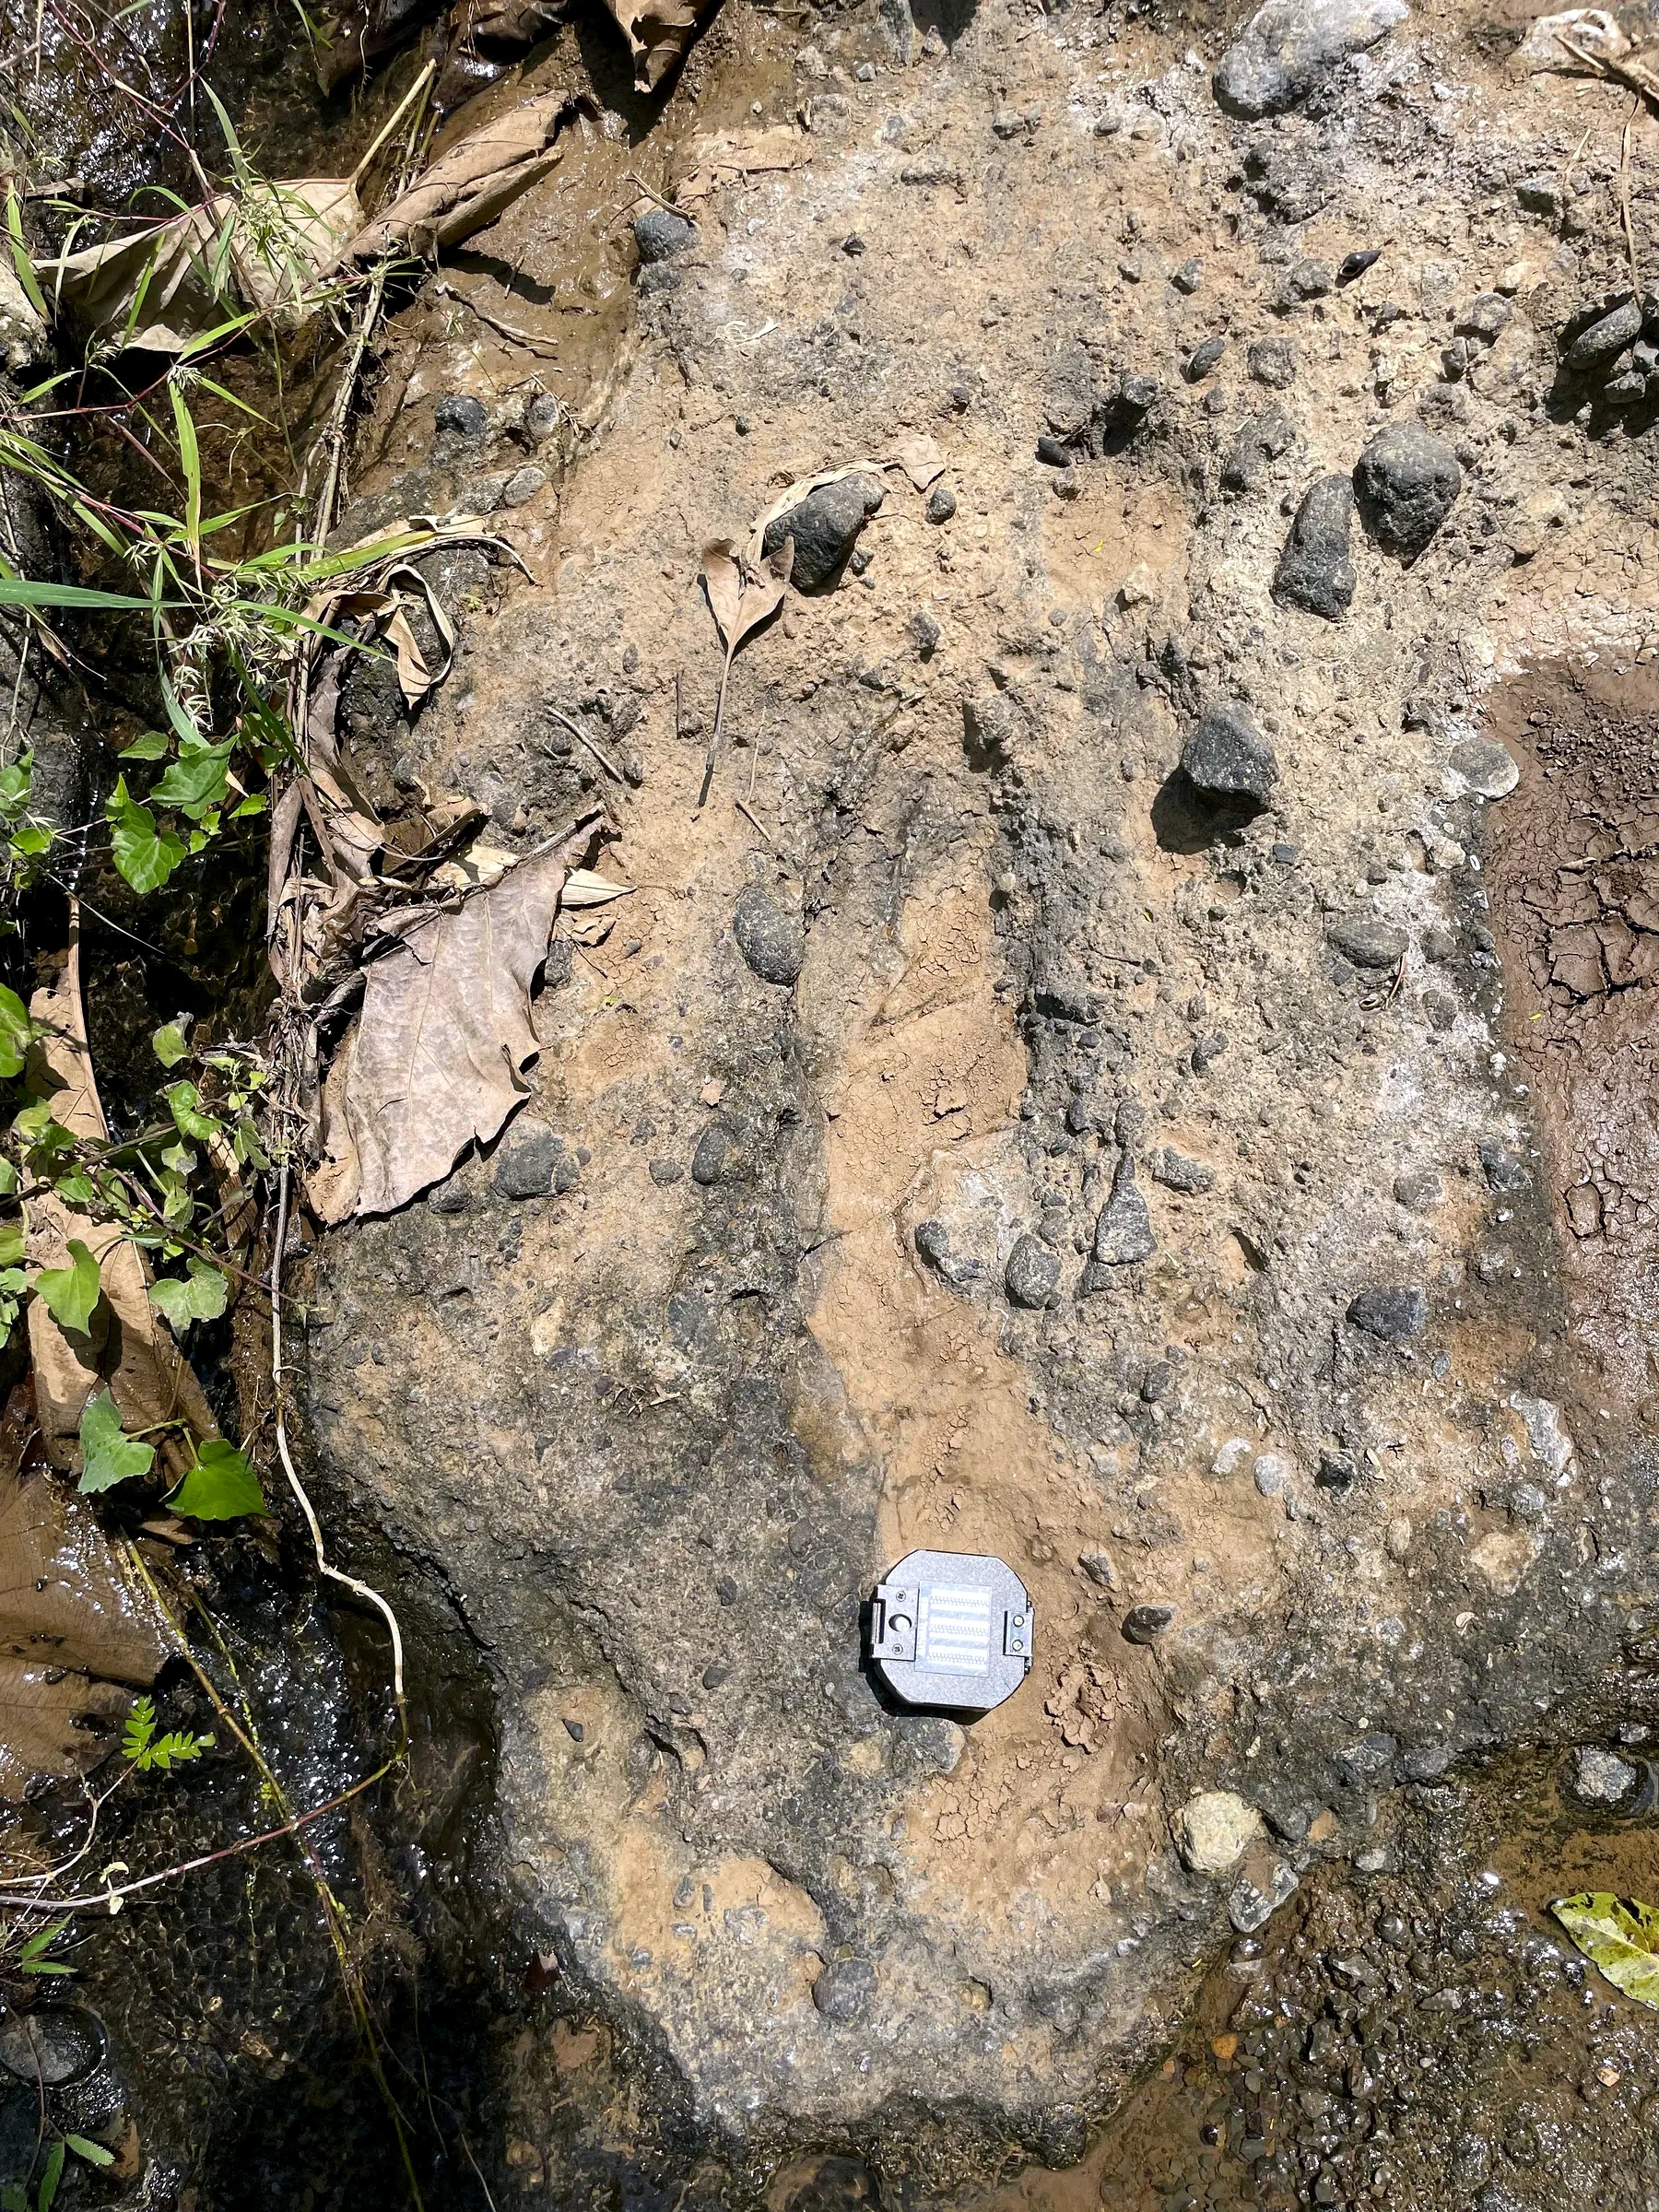
The breccia photographs belong to the Kumbang Formation. At LP80 the source describes a massive, non-calcareous, very poorly sorted deposit with angular to subrounded pebble-size andesitic fragments in a sandstone matrix with silica cement; the stream exposures preserve the same coarse, matrix-rich character at hand-specimen and person scale. That fabric supports high-concentration volcaniclastic mass transport. It does not yet distinguish a primary volcanic breccia from reworked epiclastic debris flow, because clast-size statistics, matrix petrography, basal contact, grading and internal stratification are not recorded in the photograph. The thin section identifies one andesitic clast and cannot be generalized automatically to every clast or to the depositional mechanism.
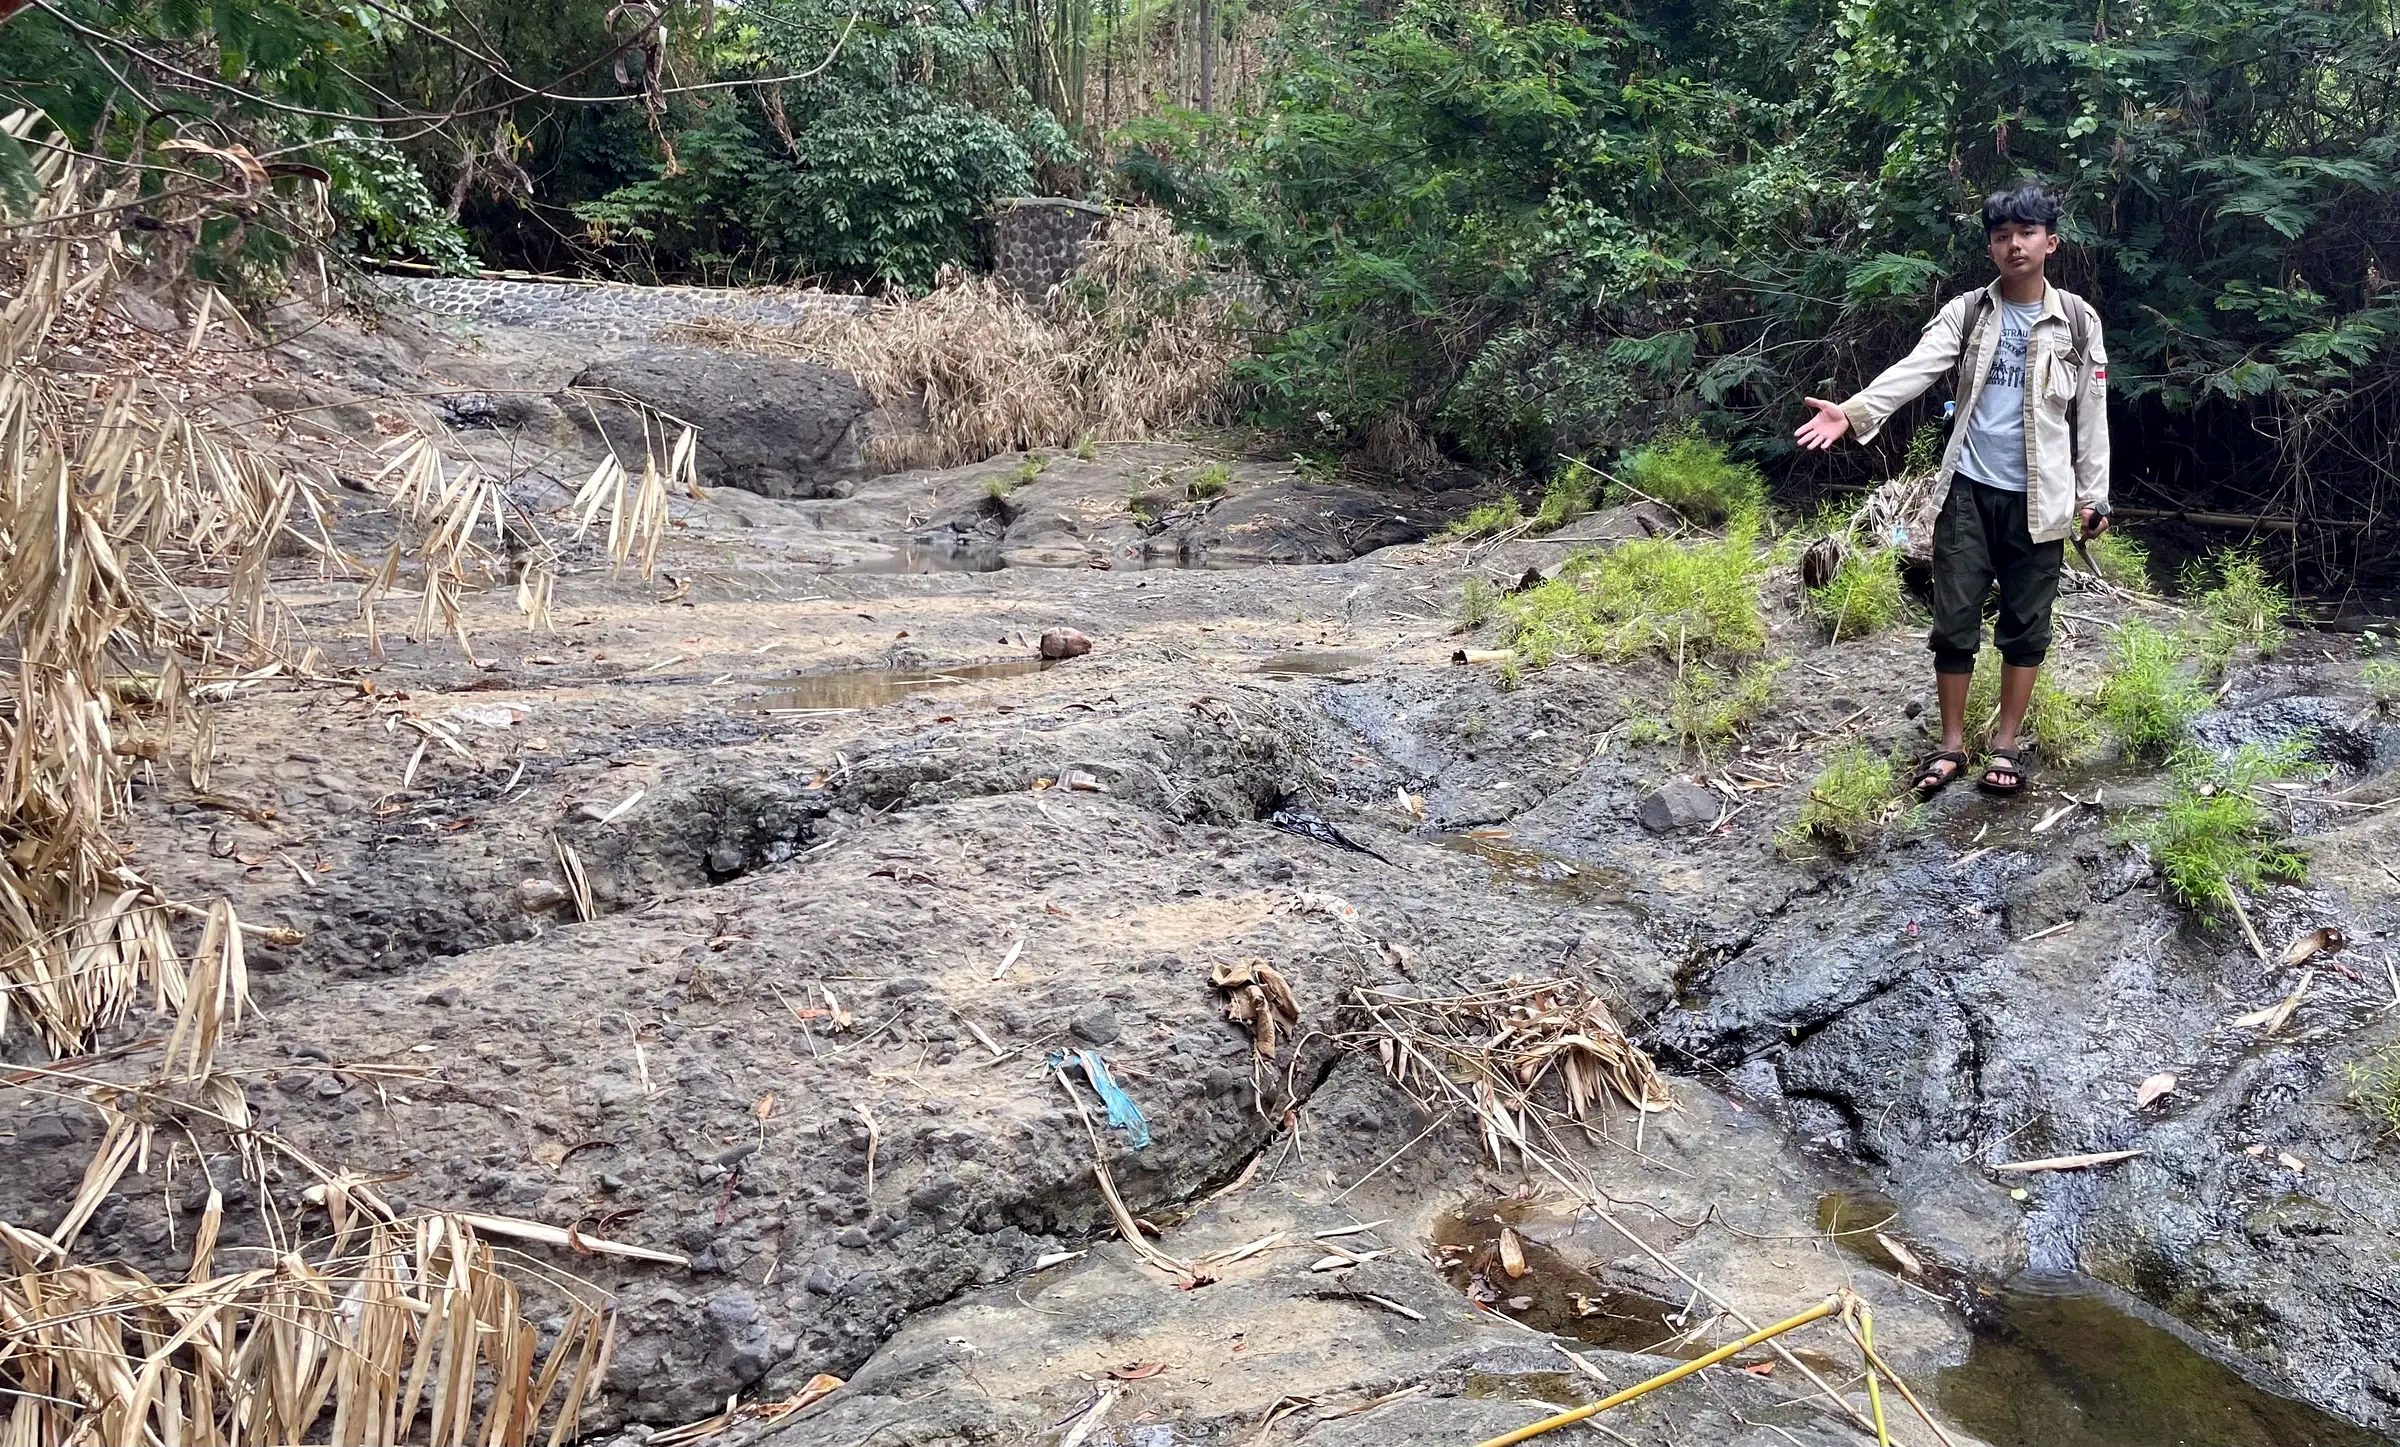
SCIENTIFIC PLATES
Surrounding report prose and captions are excluded. Every retained figure or table is followed by one English, single-column analytical paragraph that separates observation, interpretation, alternatives, uncertainty and verification.
mapping-4-1
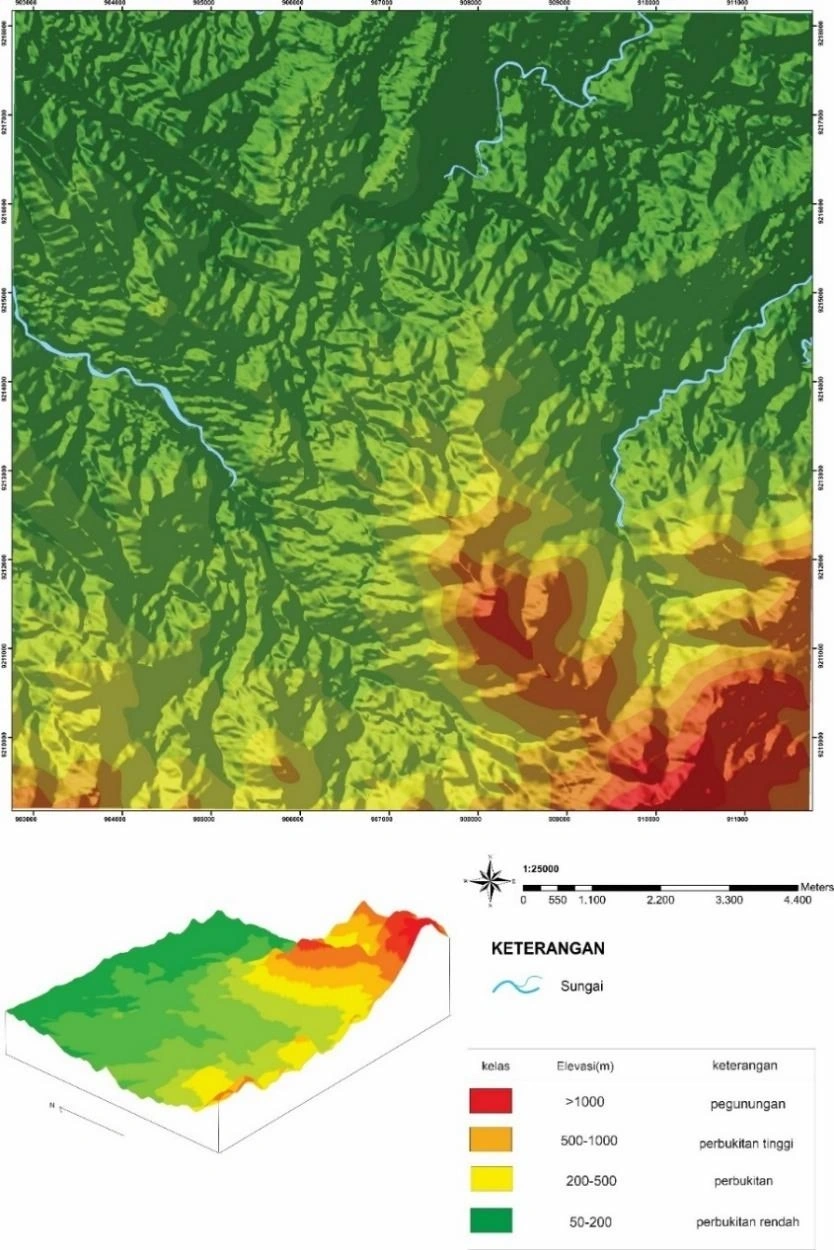
The elevation model establishes the first-order physiographic boundary conditions of the 81 km² survey, but elevation alone cannot discriminate lithology or structure. The defensible interpretation is therefore relational: compare ridge continuity, valley spacing and break-of-slope geometry with mapped contacts, measured attitudes and field stations, then test whether relief persists after normalising for drainage position. Before quantitative reuse, the DEM source, vertical datum, horizontal CRS, cell size, resampling method and contour interval should be reported; otherwise apparent lineaments may be raster artefacts. Its principal value is as a spatial hypothesis generator and topographic control for subsequent geomorphic, structural and access analysis, not as independent proof of formation boundaries.
mapping-4-2
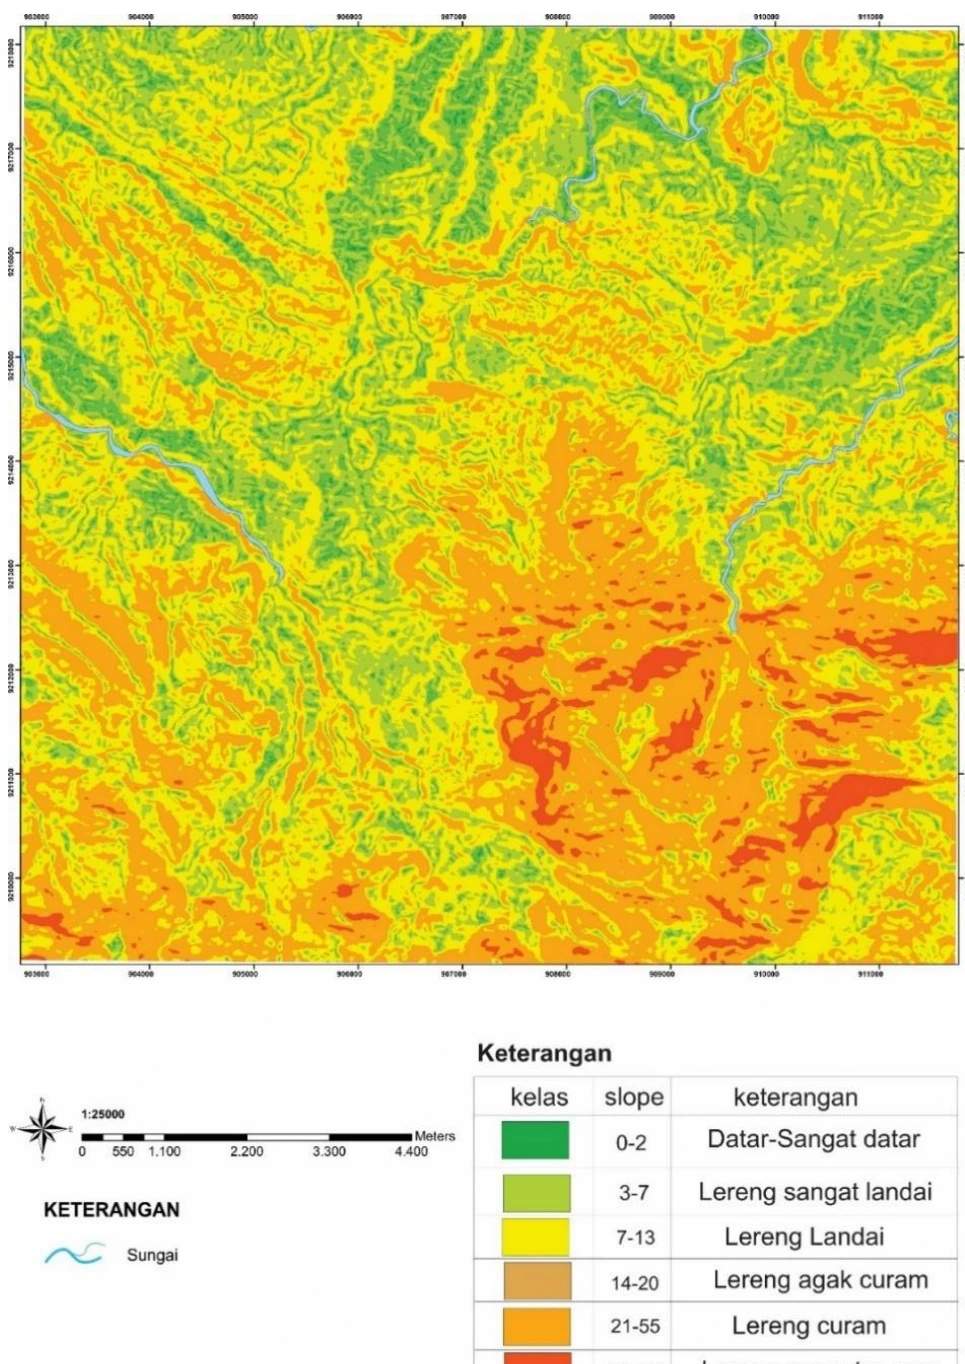
The slope product converts topography into a process-sensitive surface that can support terrain segmentation, traverse planning and first-pass instability screening. A displayed maximum near 140% is plausible when slope is expressed as rise/run percentage, but would be impossible if read as degrees; the legend must therefore retain the unit and the calculation should state neighbourhood, cell size and whether percent or angular slope was used. High values are not landslide susceptibility by themselves because material strength, discontinuity orientation, drainage, vegetation, road cuts and rainfall are absent. The map becomes analytically powerful only when co-registered with lithology, structural domains, observed failures and exposure density, with uncertainty flagged where steep slopes coincide with sparse control.
mapping-4-3
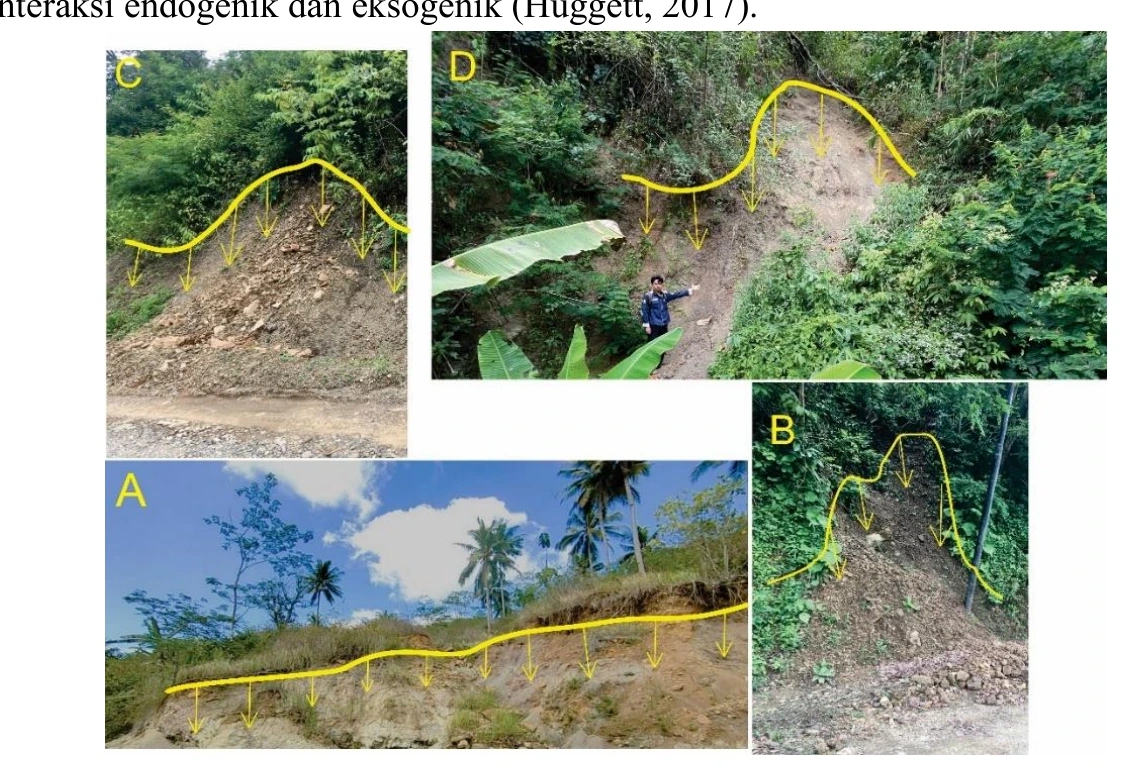
The landslide montage confirms that slope failure occurred at several mapped localities and provides valuable scale, material and morphological context, yet photographs alone cannot establish a regional causal mechanism. Each site should be indexed to coordinates withheld from the public view, date, failure type, estimated dimensions, scarp and toe morphology, weathering profile, antecedent rainfall and any anthropogenic cut or drainage modification. The images can then be compared against slope class, lithology and structural fabric to separate translational failure along bedding or joints from rotational, debris-flow or shallow soil processes. Without that event-level metadata, the strongest conclusion is occurrence verification; susceptibility, recurrence and hazard zoning remain hypotheses requiring systematic inventory and temporal evidence.
mapping-4-4
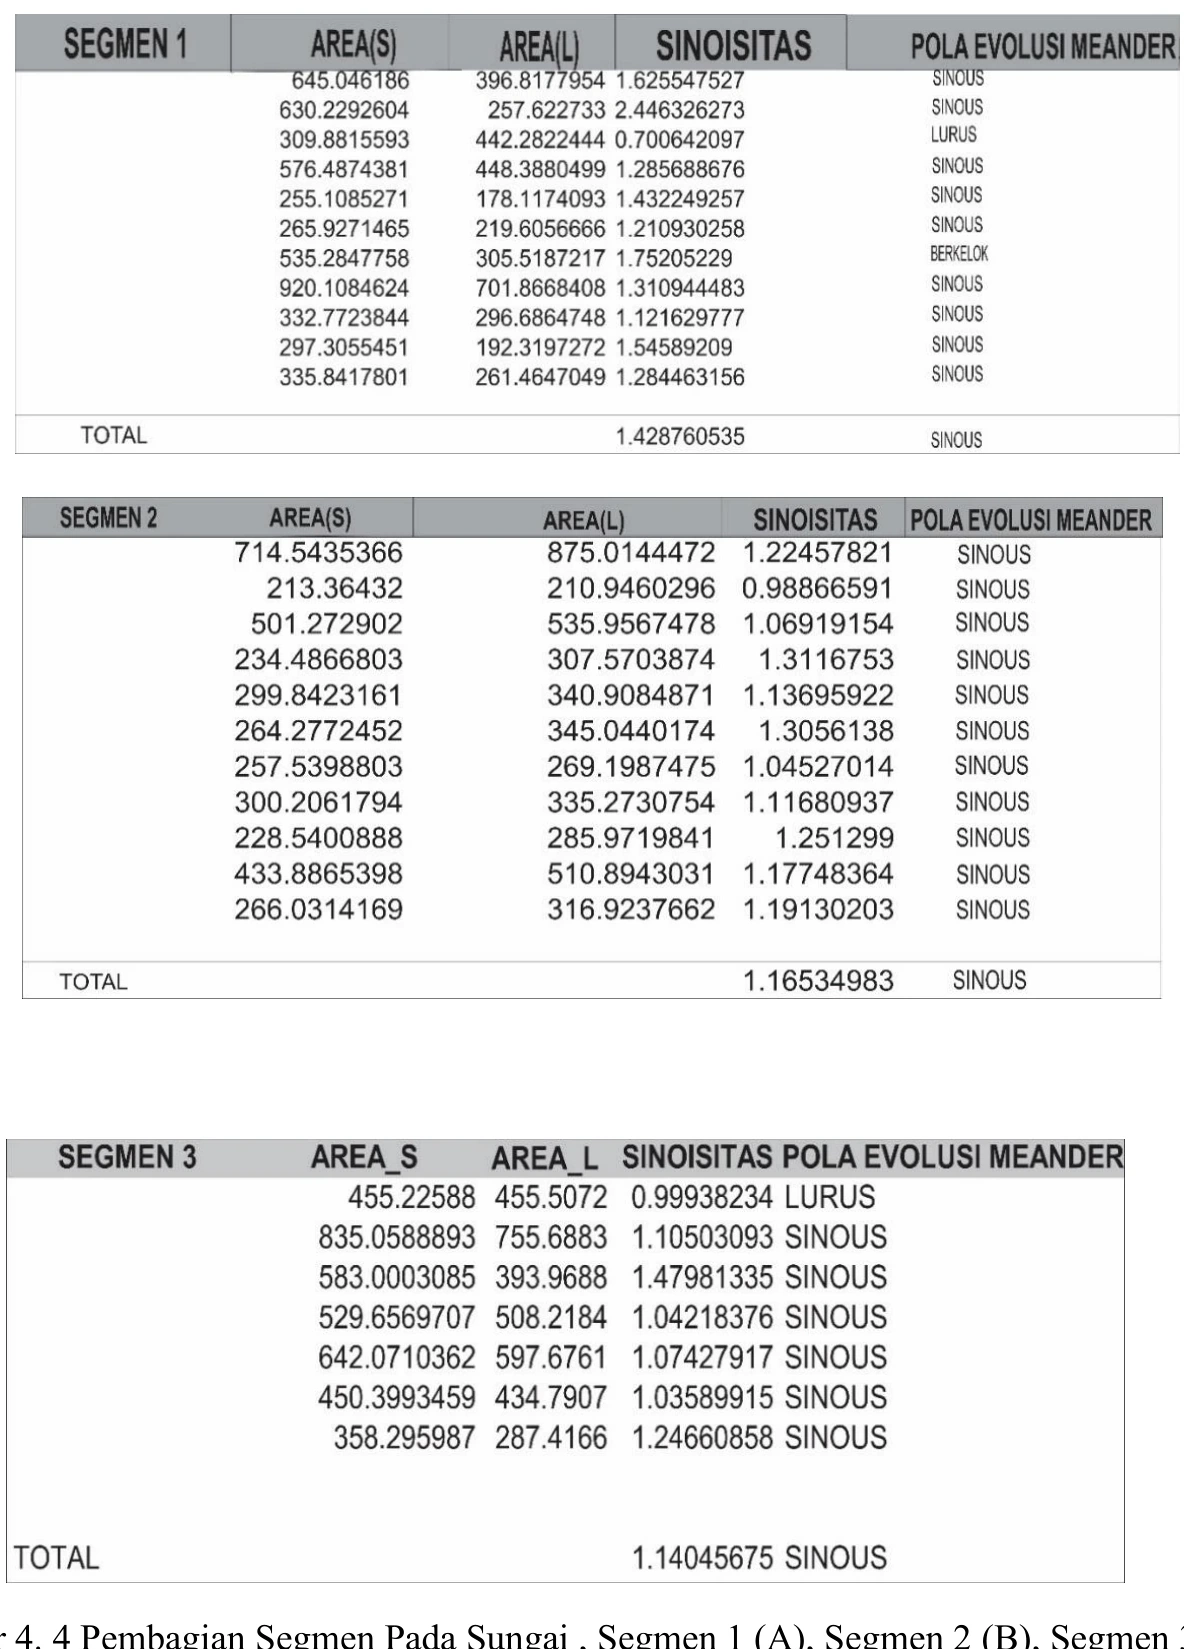
The river segmentation is useful if the reaches were divided by reproducible changes in gradient, confinement, sinuosity, substrate, tributary junctions or valley-floor width rather than by visual convenience. A process-based reading would test whether knickpoints or abrupt planform changes align with resistant units, mapped structures or base-level transitions, while recognising that discharge, sediment load and human channel modification can produce similar geometry. Segment length and boundary criteria should be tabulated, and channel metrics should be measured from a consistent imagery date and scale. The figure therefore functions as a sampling framework for longitudinal comparison; it does not, by itself, demonstrate tectonic control or a specific stage of landscape evolution.
mapping-4-5
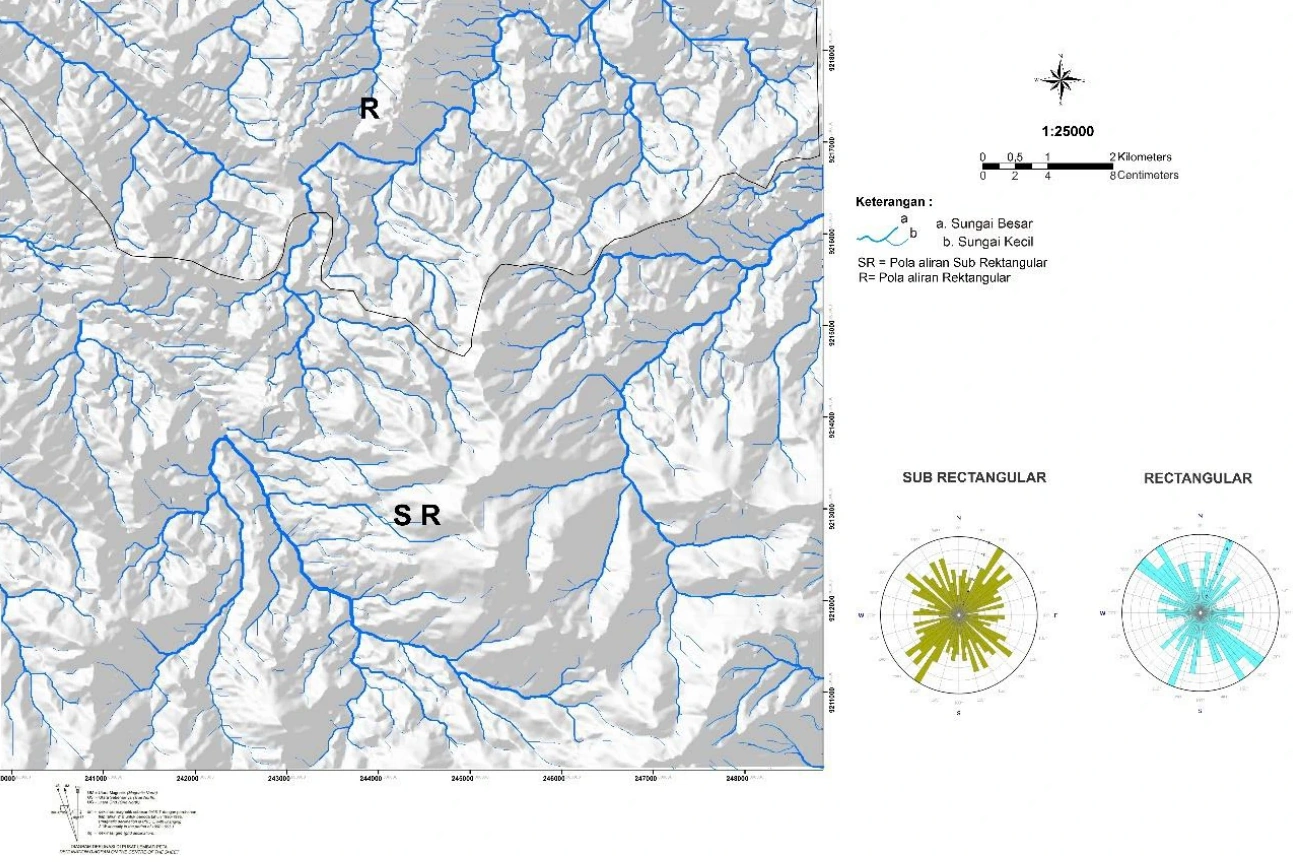
Drainage organisation records the integrated response of substrate, relief, runoff and geological discontinuities, so the map is best treated as convergent rather than diagnostic evidence. Repeated straight reaches, angular junctions or abrupt deflections may indicate fracture, bedding or fault control, but comparable patterns can arise from valley inheritance, resistant lithologic boundaries, gridding artefacts and road drainage. The structural hypothesis should be tested with orientation statistics that compare channel segments against independently measured bedding, joint and fault sets, ideally using length-weighted rose diagrams and a null distribution. Only lineaments corroborated by field kinematics, displaced contacts or damage-zone evidence should influence the final structural model; the remaining features should stay explicitly classified as geomorphic lineaments.
mapping-4-6
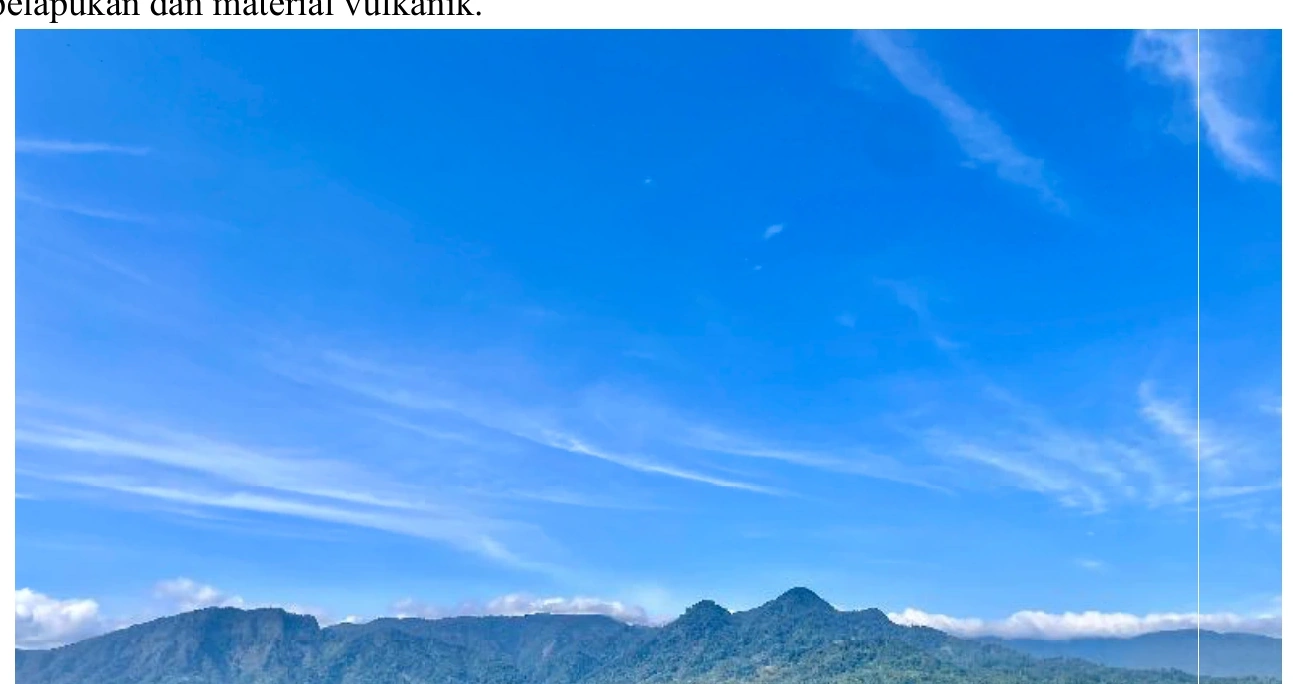
The elongated ridge is consistent with a resistant volcanic or volcaniclastic substrate, but morphology cannot uniquely identify a lava-controlled landform. Confirmation requires continuous mapping of Kumbang-related lithology, clast or phenocryst petrography, contact relationships, weathering style and structural attitude along the ridge, together with rejection of an alternative in which a competent sedimentary bed forms the same positive relief. Relief inversion is also possible if formerly low volcanic fill became erosionally resistant. The image is therefore a strong targeting observation: it predicts specific rock types and boundary geometries that should recur along strike. Its interpretation should remain conditional until those predictions are satisfied at multiple independent stations.
mapping-4-7
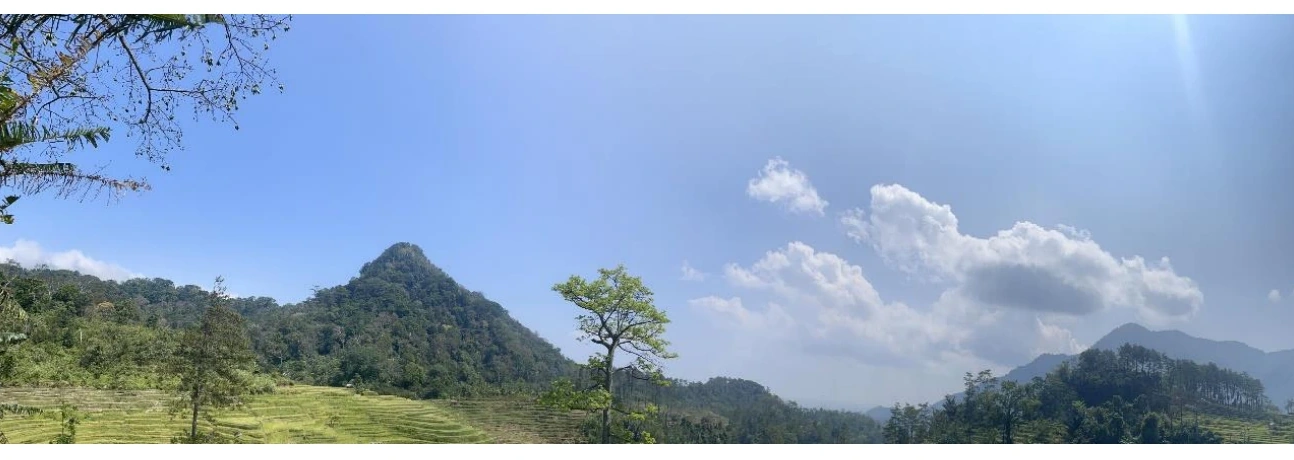
The steep-sided residual hill is morphologically compatible with karst developed in carbonate rock, especially when considered with the mapped limestone and cave photographs, yet conical form alone is not sufficient. A robust karst diagnosis should combine carbonate confirmation, closed depressions, sinking or losing streams, caves, solution grooves, springs and drainage discontinuity, while considering resistant non-carbonate hills as a competing explanation. The hill’s asymmetry and basal break in slope may also encode bedding dip, joint orientation or differential cover thickness. This plate is consequently most persuasive as part of a multi-scale karst system—from limestone microfacies through fracture-guided conduits to landscape-scale residual relief—rather than as a standalone geomorphic label.
mapping-4-8
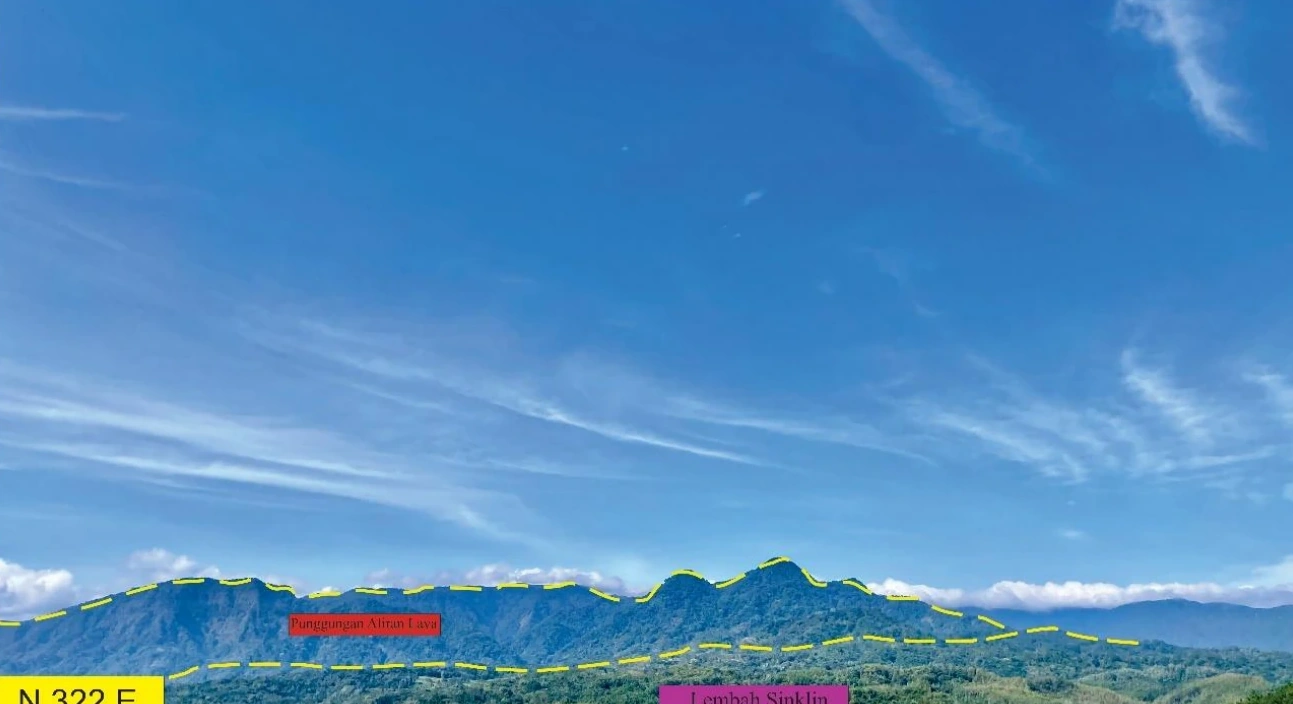
A valley positioned over a mapped synclinal domain is a plausible example of structural inversion in which erosion preferentially follows weaker or more fractured core strata, but the photograph cannot demonstrate synclinal geometry. The interpretation must be anchored by opposing limb dips, a statistically defined fold axis, contact repetition and a cross-section that honours topography and apparent-versus-true dip. Differential lithologic erodibility, fault-guided incision or inherited drainage are credible alternatives. The valley is therefore an expression to be predicted by, and then tested against, the structural model: if the fold interpretation is correct, attitude changes and stratigraphic younging should be coherent on both limbs and persist beyond the photographed view.
mapping-4-9
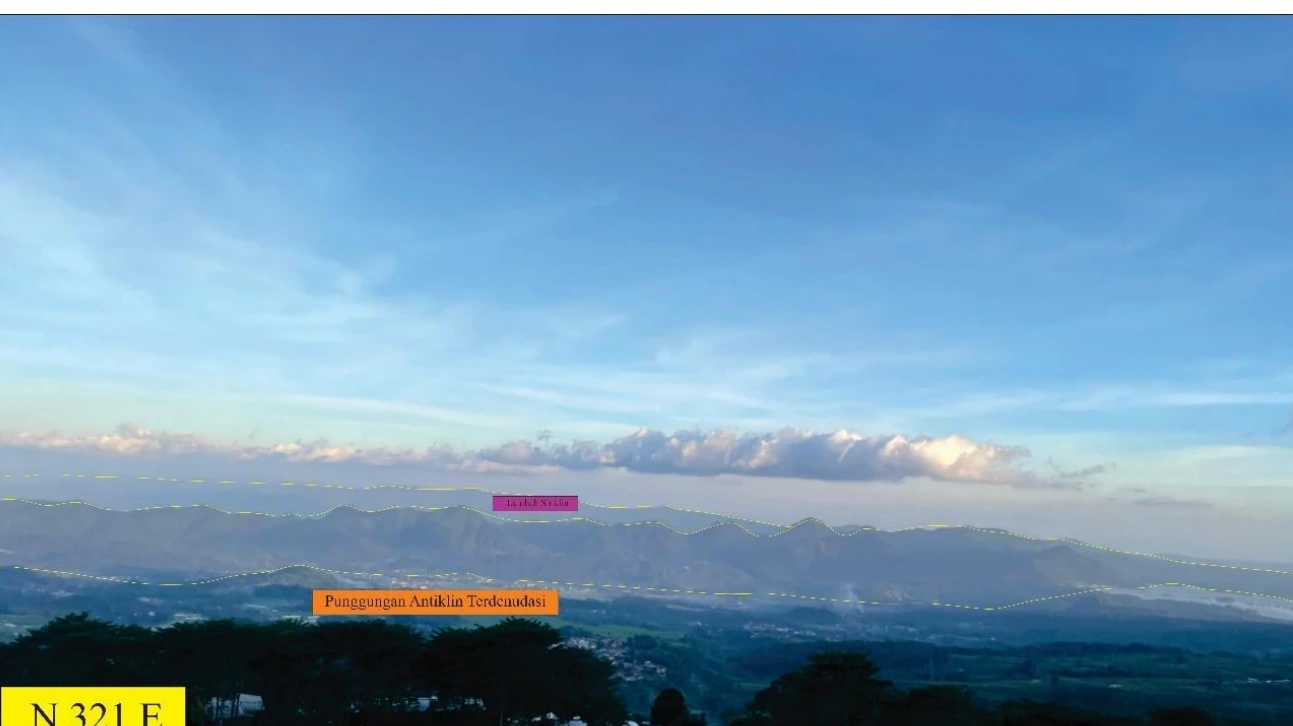
The ridge aligned with the interpreted anticline is consistent with a resistant bed exposed around a folded structural high, but positive relief is not direct proof of an anticline. A rigorous test requires mapped repetition of stratigraphic units, outward or inward younging appropriate to the fold, systematic limb dips, closure or plunge evidence, and a fold-axis solution independent of the landform. A simple resistant lithologic rib, volcanic body or drainage divide could generate the same silhouette. Accordingly, the image contributes regional-scale geomorphic coherence to the fold model but should carry lower evidential weight than measured bedding and cross-section balancing. Its value lies in checking whether the proposed geometry explains landscape organisation without being derived from that landscape alone.
mapping-4-10
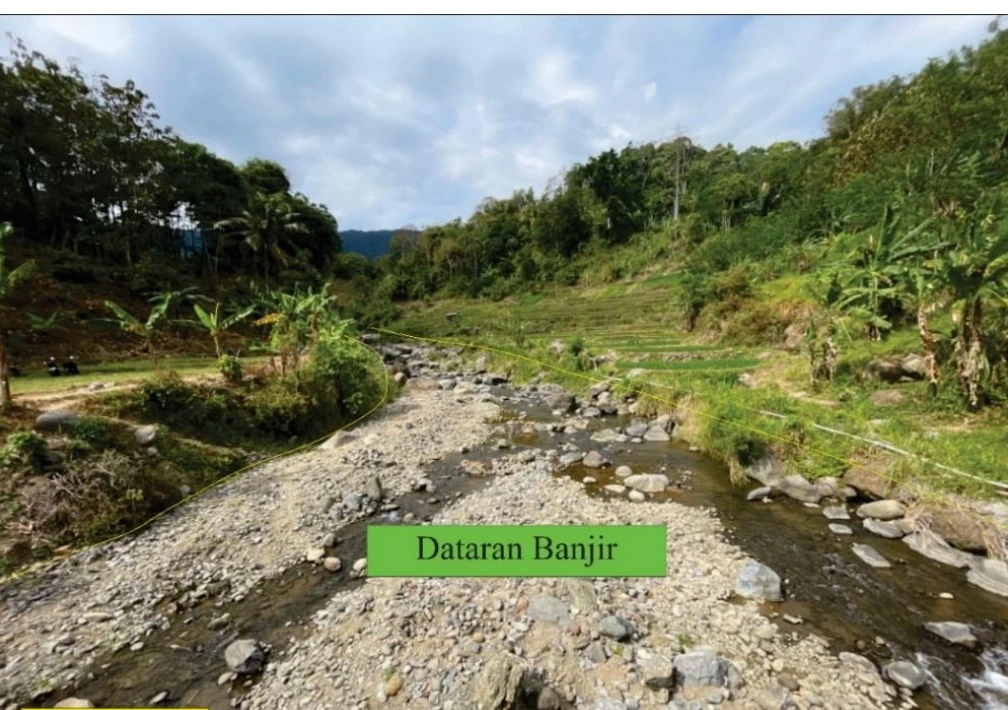
The low-relief surface adjacent to the active channel is compatible with a floodplain, although a single oblique image cannot distinguish active floodplain from a slightly elevated terrace, abandoned channel belt or anthropogenic surface. Elevation above bankfull stage, sediment texture and stratification, soil development, inundation history, channel scars and lateral continuity should be documented. The distinction matters because an active floodplain constrains present sediment transfer, whereas a terrace records an earlier base level and may preserve neotectonic or climatic information. This plate is therefore a geomorphic field observation whose classification should be supported by surveyed relative height and sedimentology; until then, the safest inference is a recent alluvial surface of uncertain activity.
mapping-4-11
The LP1 plate links a calcareous sandstone description to an exposed body and is useful because texture, bedding context and carbonate reaction can be evaluated together. Field-scale terms should remain limited to observable grain size, sorting, rounding, colour, cement reaction, bed geometry and weathering; any claim about open fabric or microscopic grain relationships belongs to thin-section evidence. The report should reconcile any difference between field and petrographic assessments of rounding or sorting and state how carbonate was identified. Spatial significance depends on whether LP1 is representative of a laterally persistent Halang sandstone package or a local bed, so correlation should be supported by measured section position and neighbouring station data.
mapping-4-11b
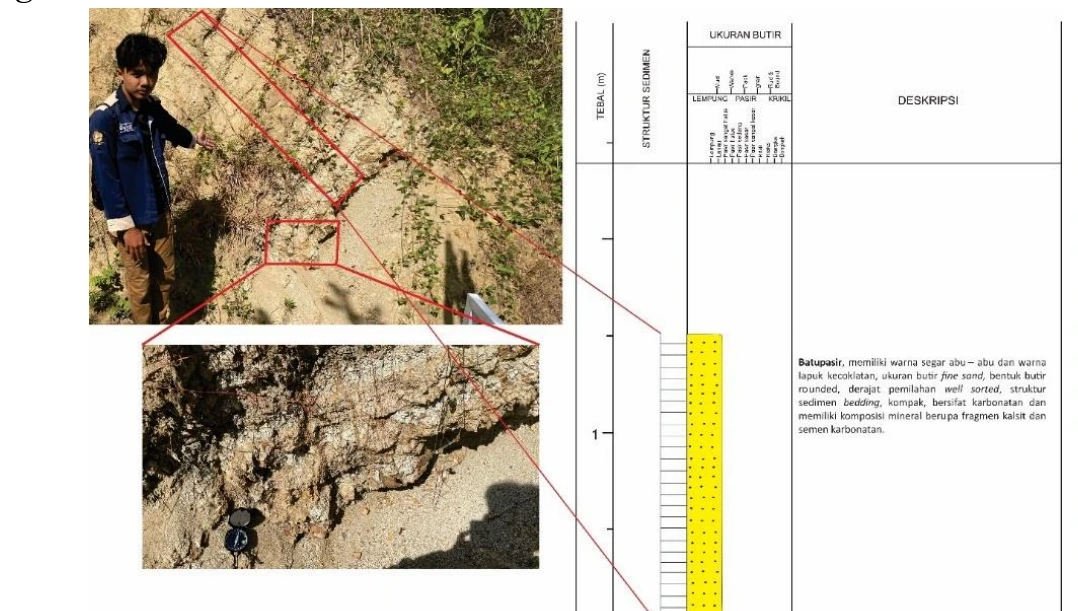
This plate is a continuation or repeated presentation of the LP1 record and must not be counted as an independent sample or additional station. Its analytical role is documentary completeness: it preserves the second visual component needed to read the original description and outcrop together. Any synthesis should therefore merge it with mapping-4-11 under one sample identity, retain provenance to both source regions and avoid inflating evidence counts. If the two panels were captured at different scales or orientations, that distinction should be stated; otherwise the duplicate should be labelled explicitly. Treating continuation sheets transparently is essential because apparent replication can otherwise create false confidence in lithologic frequency or spatial persistence.
mapping-4-12
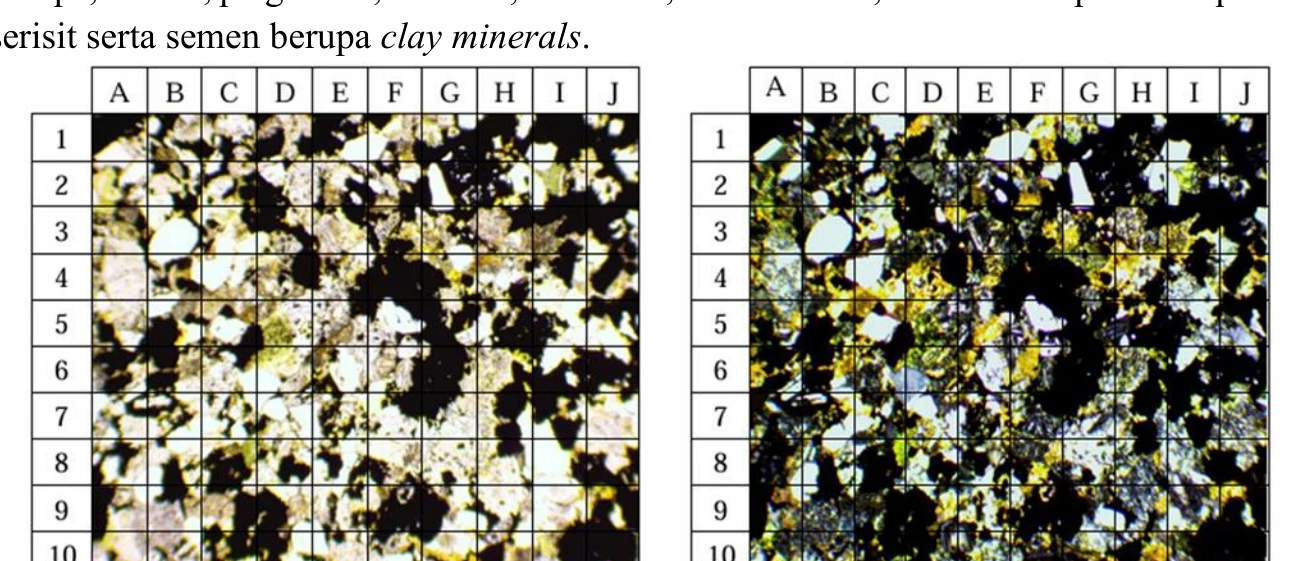
The LP22 thin section can test the mineralogical and textural basis of the sandstone classification, but only if the sample code, field station and image labels are internally consistent. Interpretation should state PPL/XPL condition, scale or calibrated field of view, point-count method and modal total, then distinguish framework grains from matrix, cement and alteration. Grain contact, compaction, carbonate replacement and fracture fill are more informative for diagenesis than a qualitative mineral list alone. Because the plate appears to support a Halang sandstone assignment, the key synthesis is whether petrographic maturity and matrix content agree with the outcrop-scale turbiditic interpretation; any mismatch should prompt a provenance or sampling review rather than forced agreement.
mapping-4-13
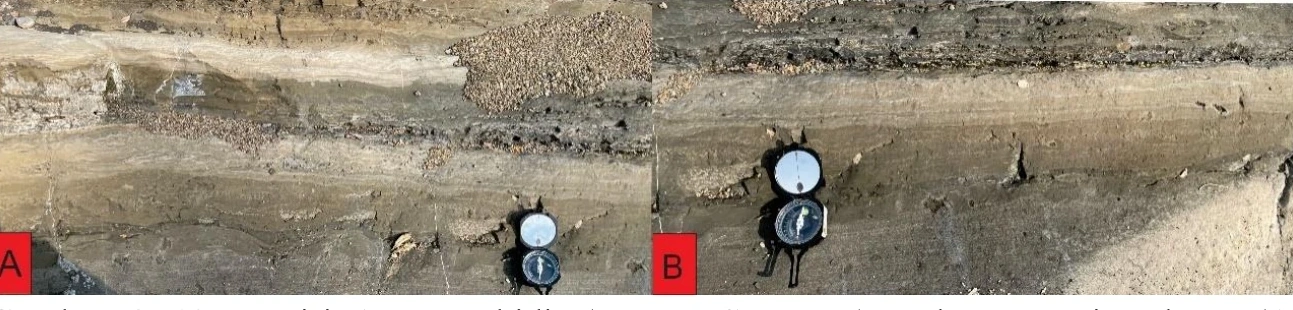
The exposed sandstone beds show parallel lamination and grain-size or weathering contrasts compatible with tractional reworking within a gravity-flow deposit. Assignment to a specific Bouma division requires sedimentary structures to be visible at the correct scale: planar lamination supports Tb, whereas ripple cross-lamination is needed for Tc, and massive or normally graded bases are required for Ta. Bed bases, tops, sole marks, grading direction, thickness and lateral continuity should be logged before a complete turbidite sequence is inferred. The photographs therefore support process-level evidence for episodic sediment gravity flow, while the precise facies code remains conditional. Regional comparison with the documented Halang longitudinal turbidite system provides context, not a substitute for local sedimentary logging.
mapping-4-14
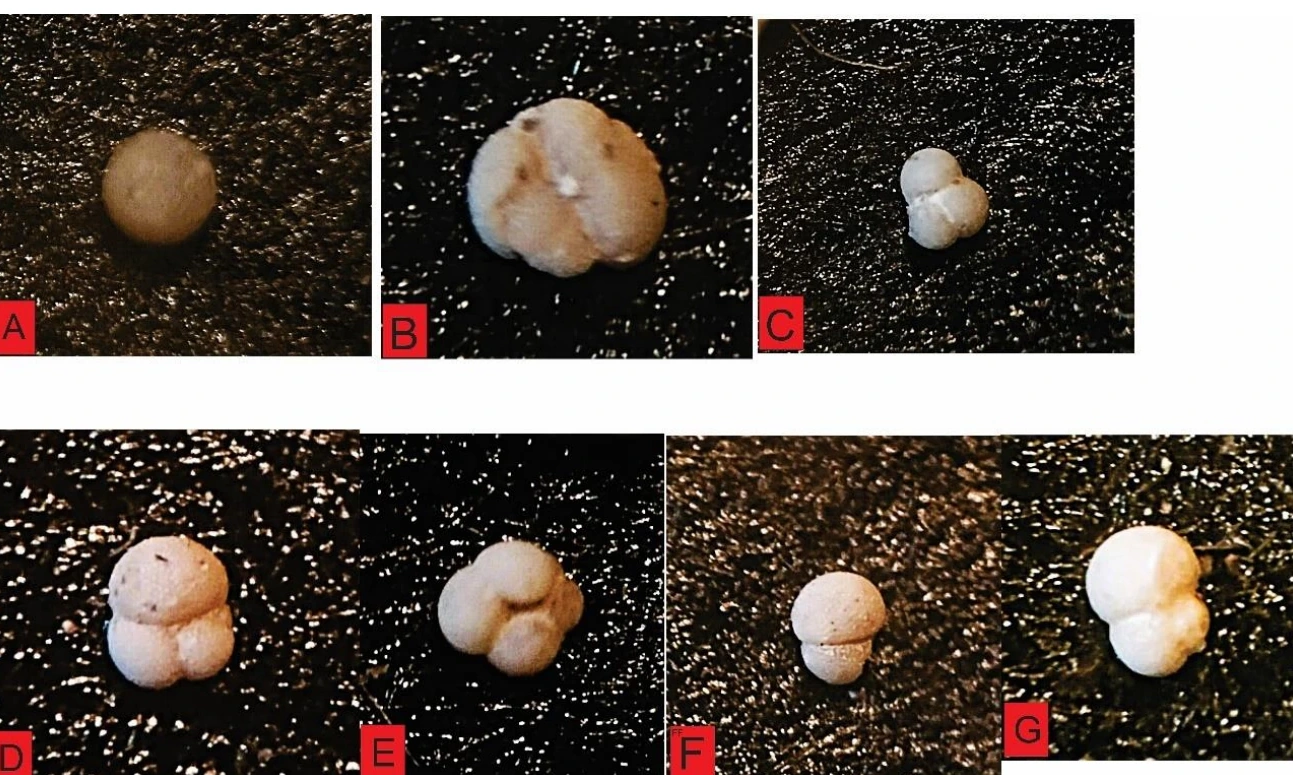
The planktonic foraminiferal plate provides potentially high-value biostratigraphic evidence, but taxonomic confidence depends on preservation, diagnostic views, scale, picking protocol and expert verification. Each identification should be tied to an individual specimen and uncertainty qualifier; reworked, broken or long-ranging taxa should not control the zonal assignment. The assemblage must be evaluated as a whole, including absence data only where sample processing and recovery are adequate. The most defensible age is the narrowest interval supported by reproducible first and last appearance datums under the selected regional zonation. Because transport and reworking are plausible in turbiditic sandstone, congruence with finer-grained samples is necessary before the plate constrains depositional age.
mapping-4-15
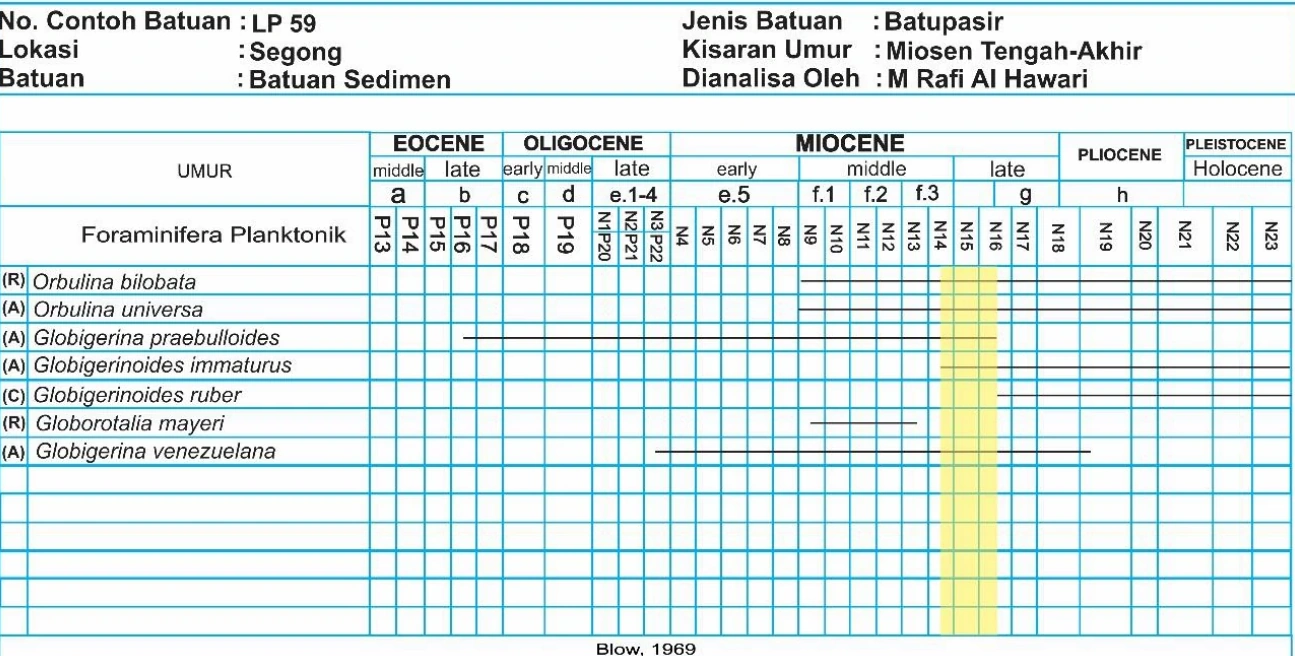
The LP59 range chart is an interpretive calculation rather than new fossil evidence: its reliability cannot exceed the underlying identifications, taxonomic ranges and chosen zonation. Range overlap should document the reference calibration, regional applicability, treatment of uncertain taxa and whether datums represent global, tropical or local bioevents. Reworking biases the result older, while caving or contamination can bias it younger; both must be considered in a gravity-flow setting. The chart is strongest when a short interval is supported by several independent, well-preserved taxa and repeated in adjacent stratigraphic samples. A single visually neat overlap should not be converted into false temporal precision without those controls.
mapping-4-16
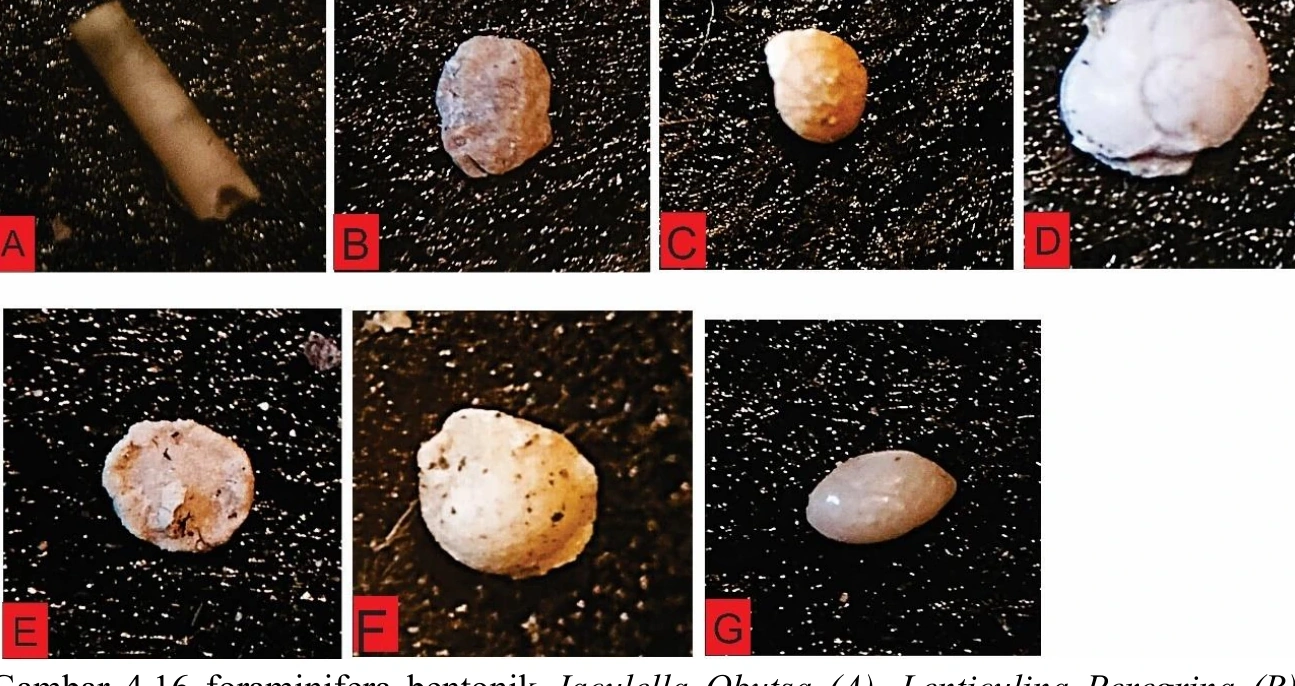
The benthic assemblage is relevant to palaeoenvironment because habitat preferences integrate oxygenation, substrate, food supply and water depth, but no taxon is a mechanical depth gauge. Interpretation should use assemblage composition, dominance, diversity, preservation and planktonic-to-benthic proportion, separating transported shallow-water forms from in-situ deeper-water taxa. In a turbidite system, downslope reworking is a central alternative and can produce mixed-depth populations. Consequently, the plate supports an environmental envelope rather than a single bathymetric number. Agreement with sedimentary facies, grain size, trace fossils and multiple samples would elevate confidence; inconsistency should be reported as evidence for transport, ecological stress or taxonomic uncertainty rather than averaged away.
mapping-4-17
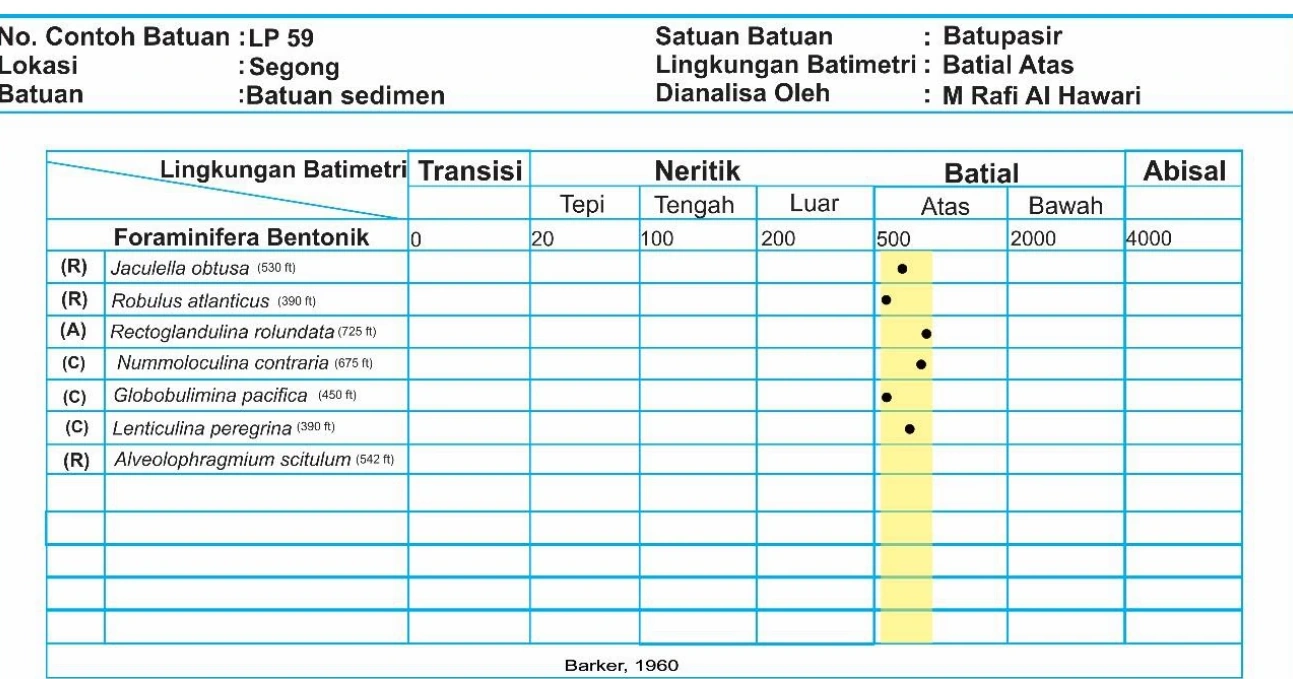
The palaeobathymetric chart synthesises ecological ranges for LP59 and is useful as an auditable bridge between taxonomy and environmental interpretation. Its endpoints should not be read as exact depositional depths because published ranges overlap broadly and respond to oxygen, productivity and substrate as well as depth. The analysis should identify which taxa actually define the envelope, whether those specimens are abundant and well preserved, and how reworking was screened. A sensitivity test that removes each controlling taxon in turn would reveal whether the conclusion is robust or dependent on one identification. The preferred result is therefore a stated depth zone with uncertainty and competing transport explanation, integrated with independent sedimentological evidence.
mapping-4-18
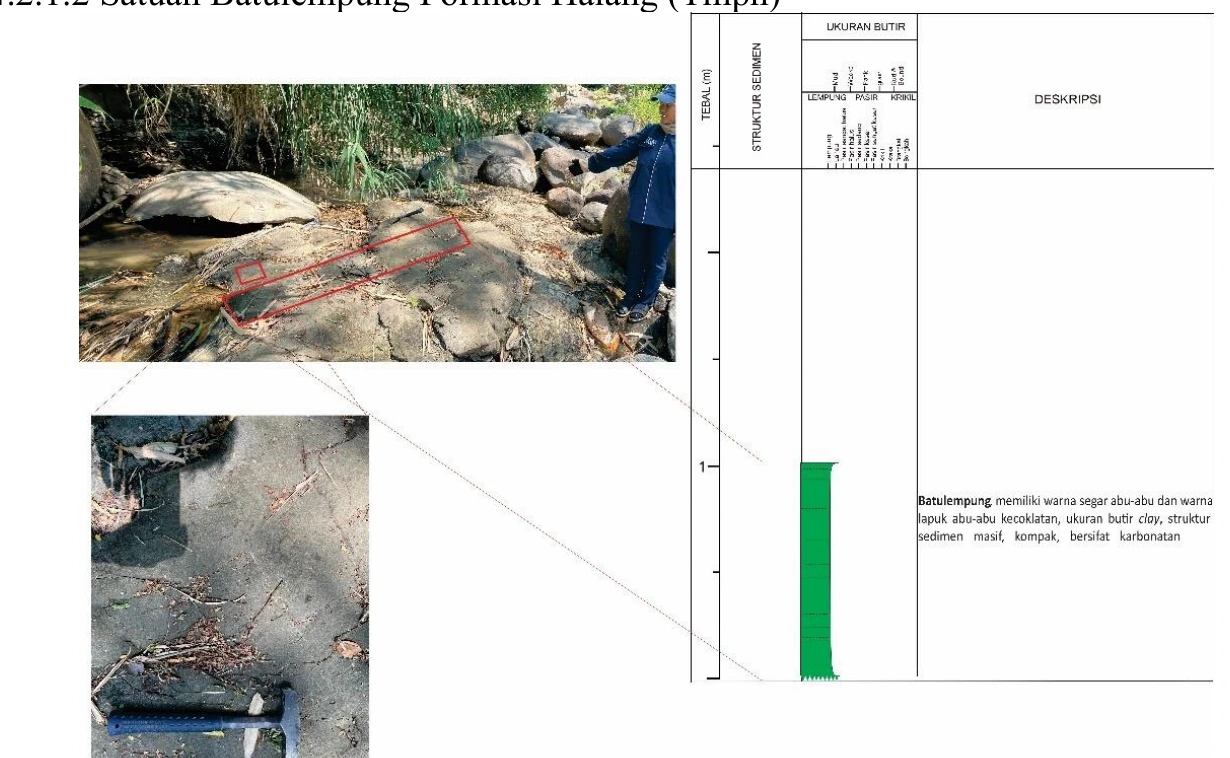
The LP13 exposure supports the presence of a fine-grained calcareous lithology, but claystone field description must avoid microscopic concepts such as rounded clay grains or open packing that cannot be resolved at outcrop scale. Defensible attributes include fissility, hardness, bedding thickness, reaction to dilute acid, colour, fracture style, weathering and relationships with adjacent sandstone beds. The carbonate response should be distinguished from surficial caliche or vein fill. Environmentally, the unit may record lower-energy suspension fallout or distal turbiditic deposition, yet that inference requires measured interbed architecture and sedimentary structures. The plate is most valuable as a logged lithofacies station whose microscopic and biostratigraphic tests are supplied by separate, traceable samples.
mapping-4-19
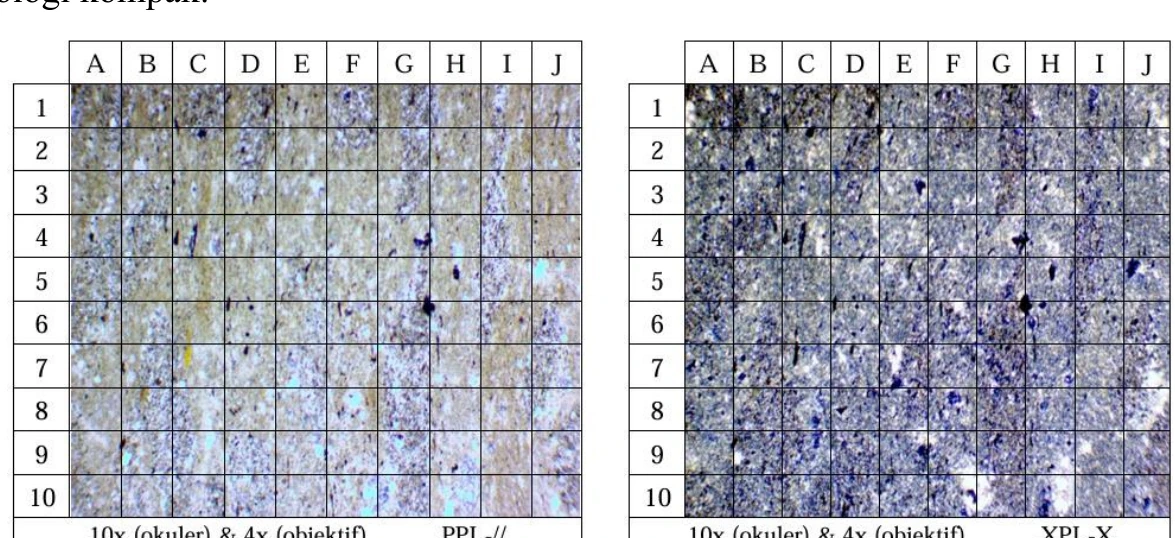
The LP4 thin section can substantiate a clay-rich rock only if imaging resolution and preparation permit matrix, silt grains, carbonate and alteration products to be distinguished. A very high fine-matrix proportion supports mudrock classification, but optical estimates should be described as semi-quantitative unless point counted, and clay mineral species cannot be confidently assigned from routine transmitted light alone. XRD would be the appropriate test for mineralogical composition. The analytical priority is to connect matrix abundance, lamination, cement and microfracturing to the field behaviour of the fine-grained Halang interval. Terminology should follow a consistent grain-size and fissility scheme rather than mixing petrographic and hand-specimen classifications.
mapping-4-20
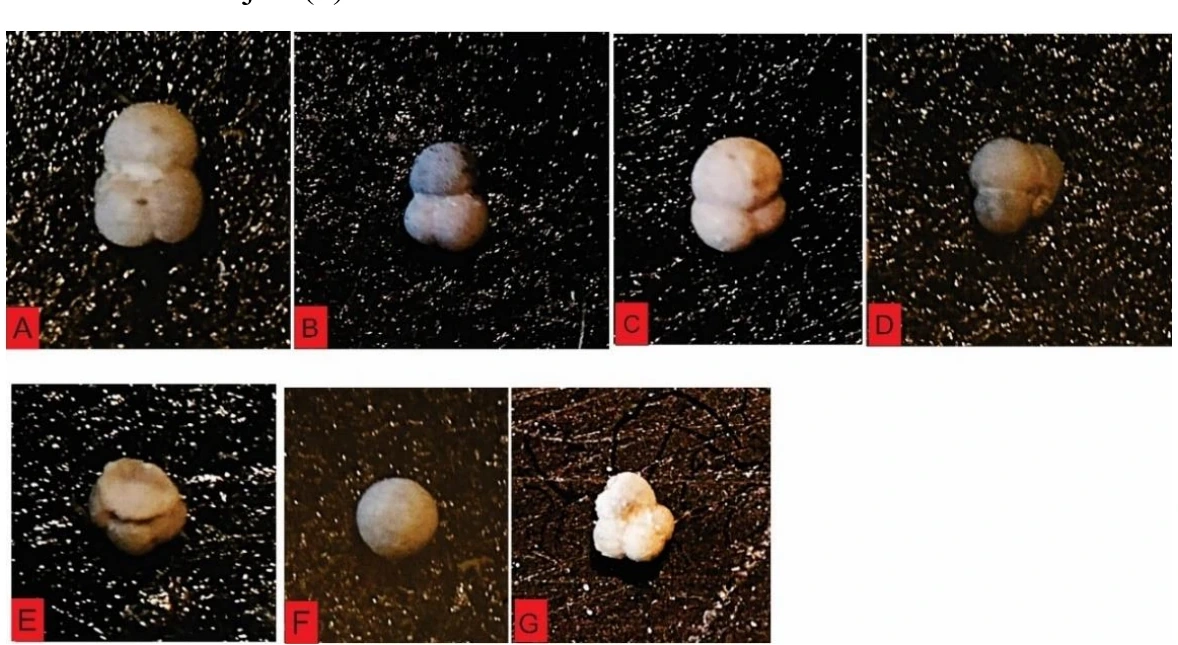
The claystone planktonic assemblage may provide a more nearly depositional age than sandstone-hosted specimens because fine-grained sediment is less likely to contain coarse reworked lag, but reworking and contamination remain possible. Diagnostic morphology, scale, preservation and specimen-specific labels should be documented, with uncertain identifications excluded from zonal boundaries. Comparison with the LP59 sandstone assemblage is especially informative: concordant zones would strengthen formation-scale age control, whereas systematic older ages in sandstone could indicate reworking. The plate should therefore be analysed as part of a stratigraphic sample series rather than in isolation, and the final age statement should preserve the resolution and uncertainty of the least secure controlling datum.
mapping-4-21
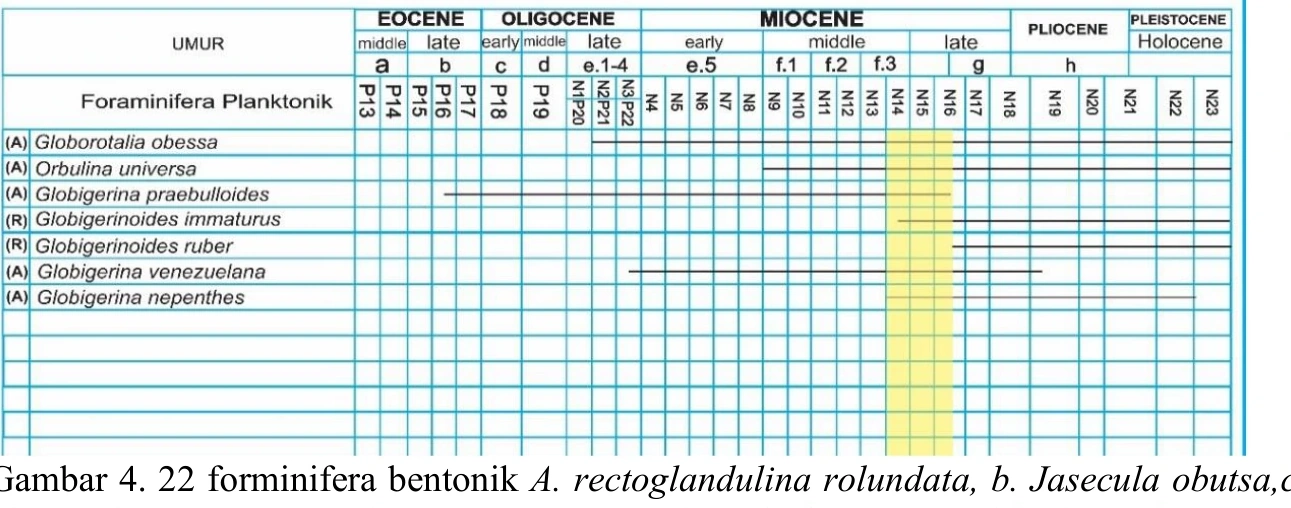
The LP21 range chart should make the inferential chain fully reproducible: specimen identification, published range, selected zonation, overlap interval and final confidence. A zonal conclusion is robust only when multiple diagnostic taxa converge and when the sample’s stratigraphic position is secure. Long-ranging species add little temporal resolution, while a single short-ranging species may create fragile precision if preservation is poor. Reworked fossils, laboratory cross-contamination and taxonomic synonymy are the principal counter-explanations. The chart is therefore best presented with a sensitivity interval and explicit qualifiers, then cross-checked against LP59 and LP51 so that age relationships obey mapped stratigraphy rather than being adjusted after the fact.
mapping-4-22
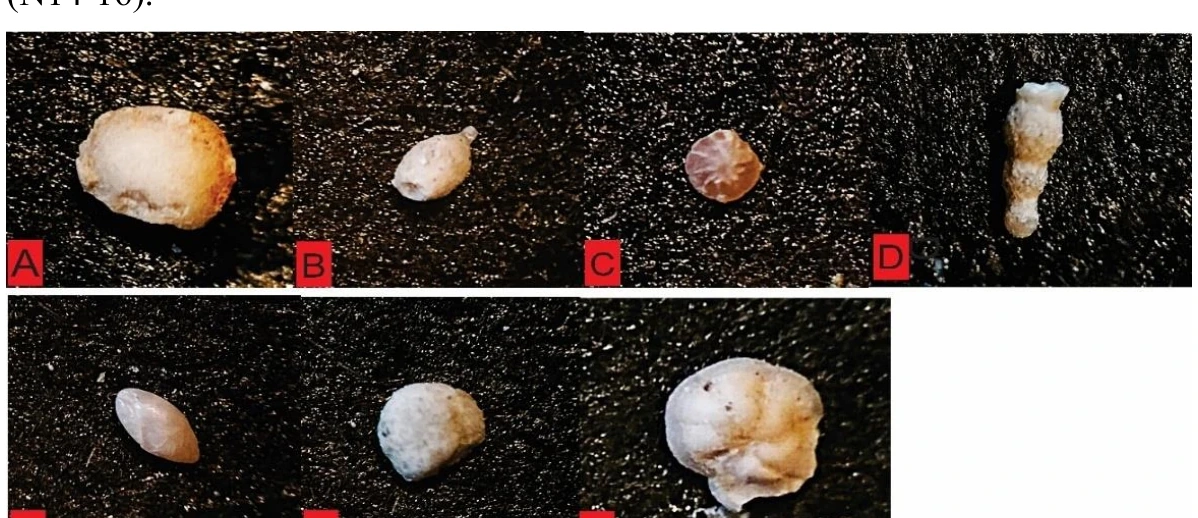
The LP21 benthic plate is an assemblage-level environmental dataset, not a collection of independent depth markers. Relative abundance, diversity, wall composition, preservation and evidence of transport should accompany identifications. Fine-grained host lithology may favour quieter-water deposition, but low-energy substrate, reduced oxygen or high organic flux can shift benthic composition independently of bathymetry. The environmental inference should therefore be framed as a probability distribution across shelf-to-bathyal settings, narrowed only where several ecologically coherent taxa dominate and sedimentological evidence agrees. A mixed population is geologically meaningful: it may record downslope transport or reworking within the Halang turbidite system rather than analytical failure.
mapping-4-23
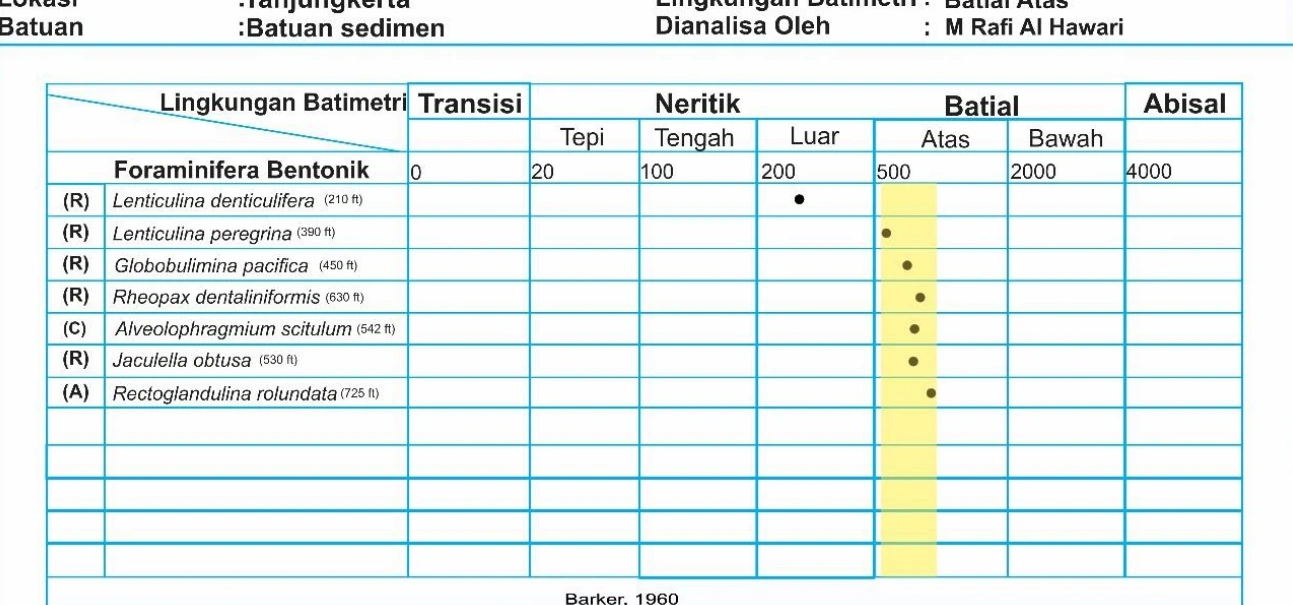
The LP21 depth chart reportedly places the sample in an upper-bathyal envelope, a plausible setting for fine-grained deposits associated with the Halang deep-water system. That conclusion remains conditional on the ecological calibration and preservation of the controlling benthic taxa. A transparent audit should show the intersection before rounding, identify taxa with the narrowest ranges, and repeat the calculation after removing potential shallow-water reworked forms. Sedimentological consistency is required: basin-plain or overbank mudstone architecture would support the interpretation, whereas wave structures, shallow benthos or subaerial features would contradict it. The appropriate output is a bathymetric class with uncertainty, not a precise metre range presented as directly measured depth.
mapping-4-24
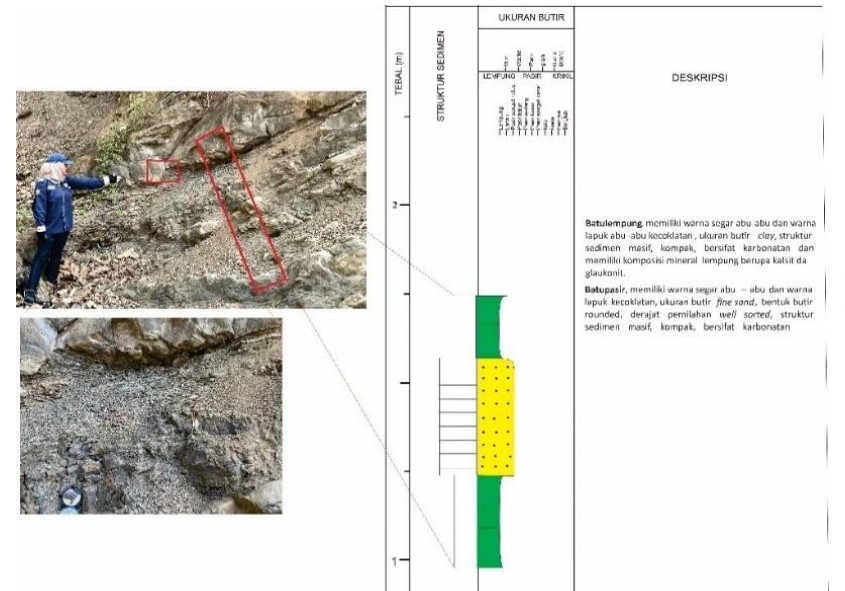
The LP22 sandstone-claystone interbeds are among the strongest process-scale observations in the dossier because repeated bed alternation, continuity and thickness can directly constrain sediment-gravity-flow architecture. A measured section should quantify bed thickness, sandstone-to-mudstone ratio, vertical trends, base sharpness, grading, sole marks, lamination and bioturbation. These attributes permit discrimination among channel-margin, lobe, overbank and basin-plain elements, but no single photograph proves a ‘middle fan’ position because submarine-fan terminology is model dependent and facies recur across settings. The exposure should therefore anchor a facies-association analysis linked laterally to other stations and compared cautiously with published Halang architectures south of Kuningan.
mapping-4-25
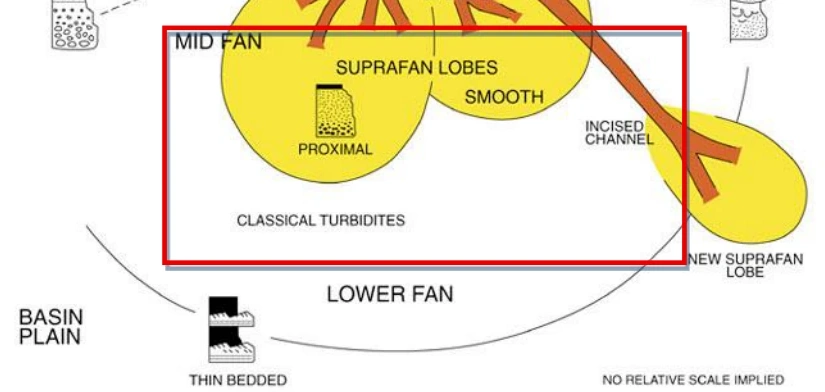
The submarine-fan diagram is a conceptual analogue used to organise observations, not field evidence from Karangkancana. Its legitimate role is predictive: a channel interpretation should anticipate erosive confinement and amalgamation; lobe deposits should show tabular beds and compensation; overbank deposits should become thinner and muddier away from conduits. Local sections can then be tested against those predictions. The model should not be used circularly—assigning a facies from the diagram and then citing that assignment as proof of the model. Because the Halang Formation has published evidence for a longitudinal turbidite system with channels, overbank, sheet sandstone and basin plain, the regional analogue is relevant, but local architecture and palaeocurrent data must decide which elements are actually present.
mapping-4-26
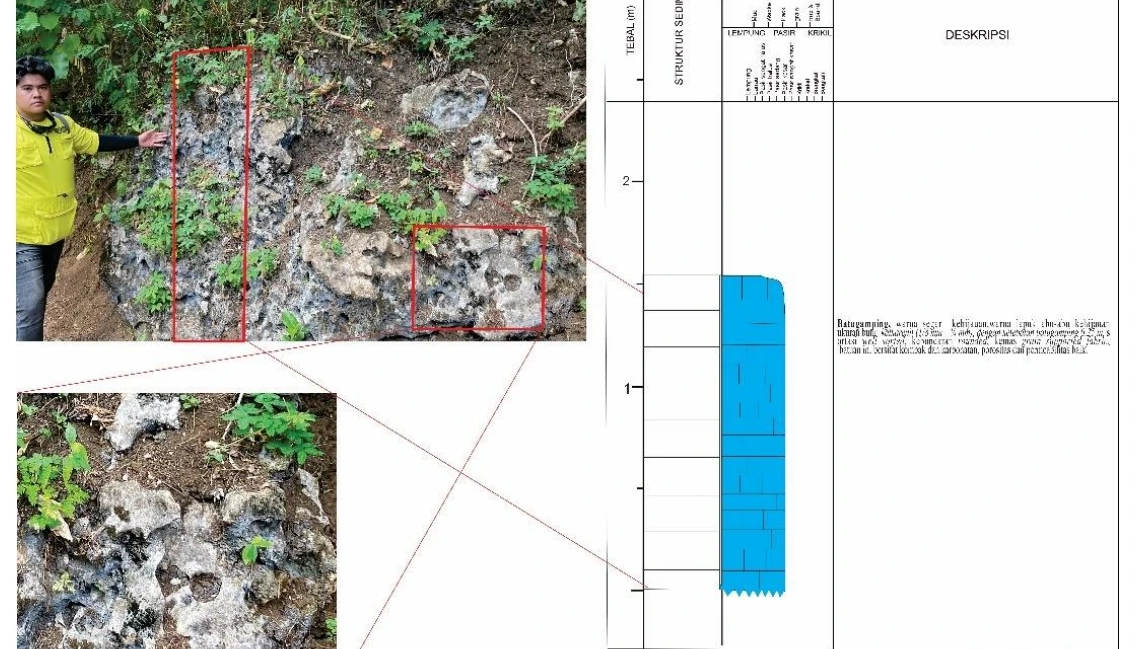
The LP51 outcrop confirms a carbonate body at field scale, but pale colour, massive appearance and cave development do not by themselves demonstrate an in-situ reef framework. The description should distinguish bedding, primary skeletal framework, clast support, matrix, stylolites, joints, dissolution and weathering. A reef interpretation requires growth position, boundstone fabric or coherent ecological construction, whereas transported bioclasts and wackestone can occur in non-reef settings. Contact geometry with Halang clastics and lateral continuity are essential for assigning member-scale stratigraphic significance. The plate therefore supports limestone occurrence and karst susceptibility; depositional setting must be resolved through microfacies, fossils, mapping relationships and taphonomic evidence.
mapping-4-27
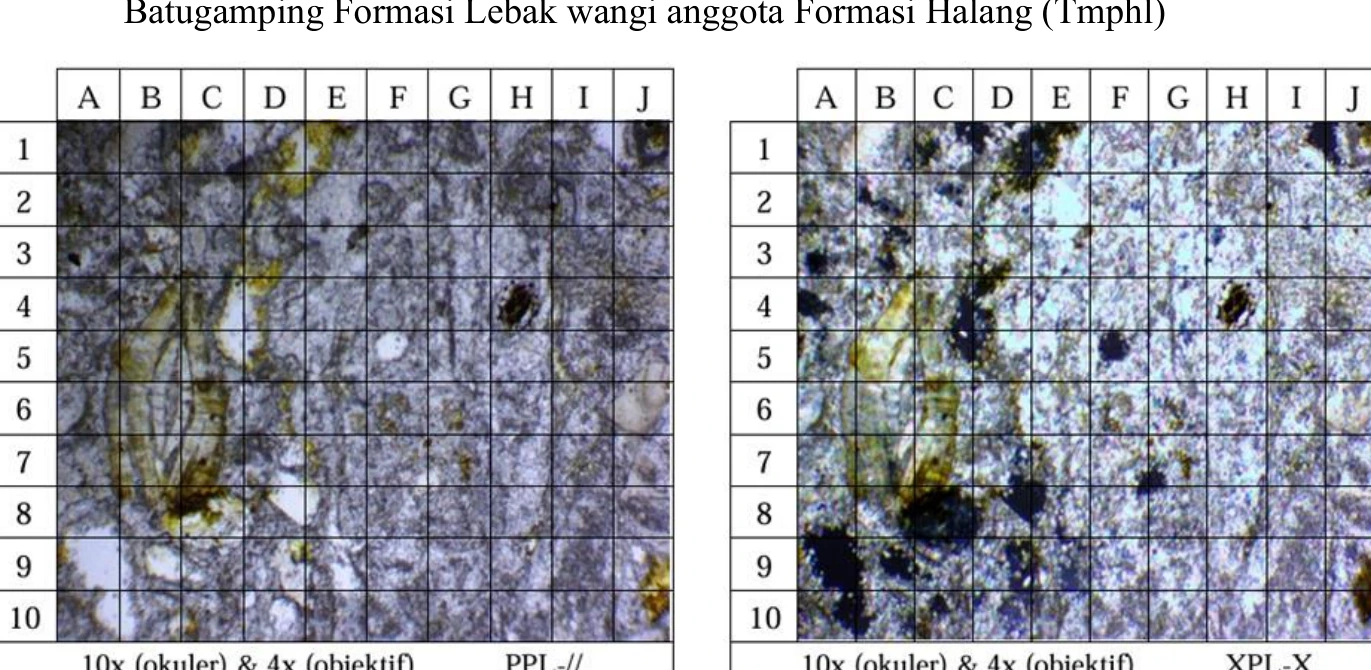
The LP82 carbonate thin section is classified as wackestone, consistent with a matrix-supported fabric containing more than ten percent allochems under the Embry and Klovan framework. Reported grain sizes of 5–15 mm at 40× magnification are physically suspect and likely reflect a unit or calibration transcription error; the scale must be corrected before textural inference. Modal percentages should total transparently and distinguish skeletal grains, pisoids, quartz, microspar, spar cement and pore space. The wackestone fabric supports relatively low-energy deposition or protected conditions, but recrystallisation and cementation may obscure primary texture. It does not independently prove reef growth, and should be integrated with field framework evidence and fossil taphonomy.
mapping-4-28
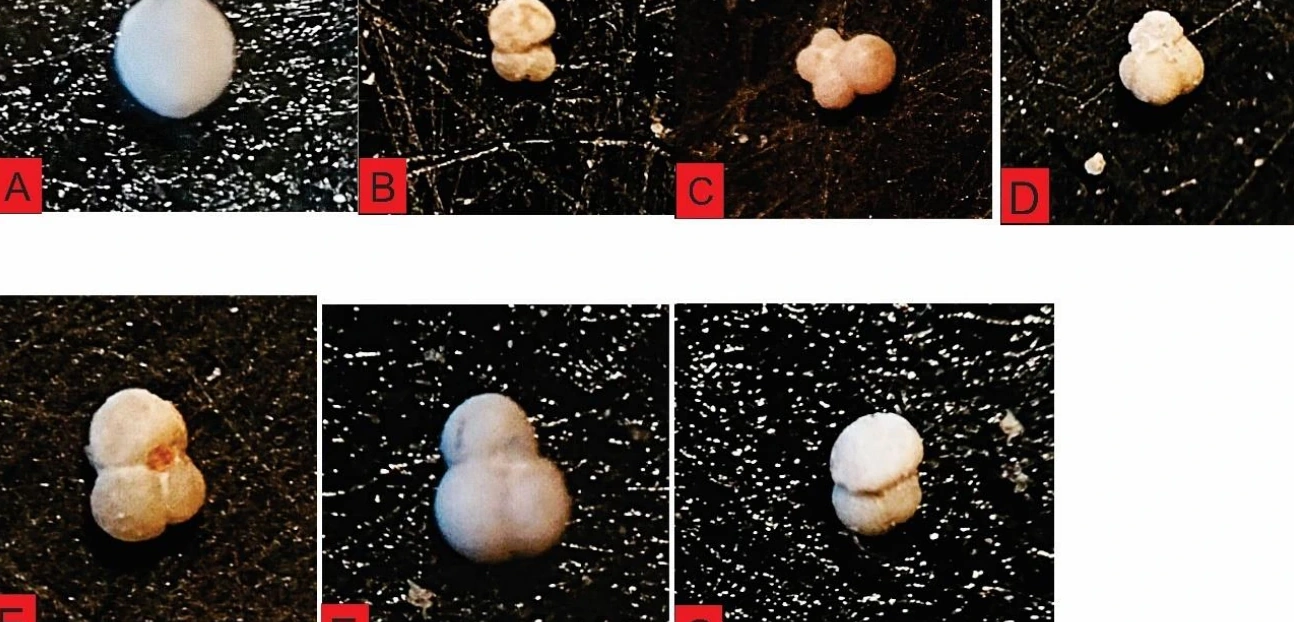
The LP51 planktonic plate is used to date the limestone, yet carbonate samples may contain reworked pelagic tests, diagenetically altered specimens or mixed material introduced through cavities. Identifications should therefore be tied to preservation state, host microfacies and individual views, with contamination and reworking explicitly screened. Several concordant age-diagnostic taxa are preferable to one visually persuasive specimen. The key regional question is whether the inferred age is consistent with mapped relationships among Halang clastics, Lebakwangi carbonate and Kumbang volcaniclastic units without forcing a simple vertical succession where lateral interfingering is possible. The plate provides a testable age constraint, not an automatic formation assignment.
mapping-4-28b
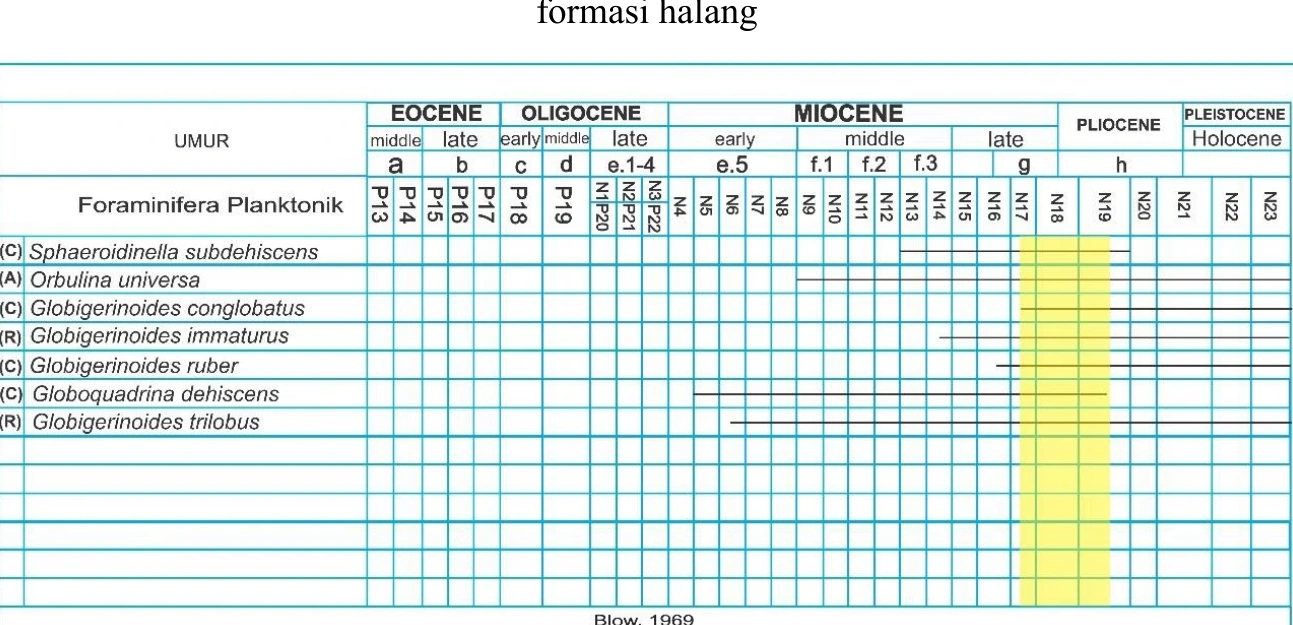
The LP51 range chart reportedly supports an N17–N19 or Late Miocene to Early Pliocene interval, but the precision and nomenclature must be tied to a named zonation and current taxonomic calibration. A broad three-zone range may be scientifically honest if diagnostic overlap is limited; compressing it to a single age would overstate resolution. Each controlling taxon should be reviewed for preservation and reworking, and the resulting interval should be compared with regional map stratigraphy as an independent check rather than adjusted to match it. The chart’s best contribution is explicit uncertainty: it defines the chronological window that remains after fossil evidence, sample integrity and zonal assumptions are all considered.
mapping-4-29
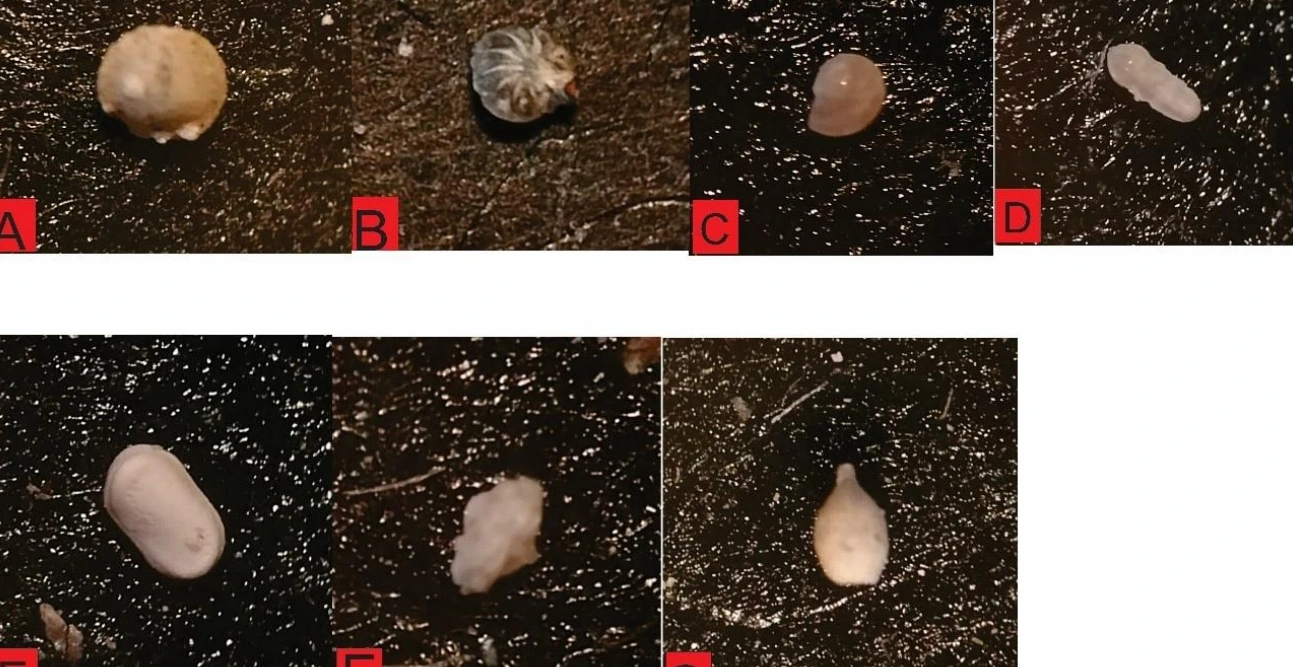
The LP51 benthic assemblage provides environmental context for carbonate deposition, but carbonate-platform, slope and deep-water taxa can coexist through downslope transport. Interpretation should document relative abundance, abrasion, fragmentation, encrustation and matrix association, then separate likely autochthonous from allochthonous components. A depth estimate based only on published endpoint ranges ignores substrate and oxygen controls. The assemblage should instead be compared with wackestone texture and planktonic content: abundant planktonic tests in fine matrix may support an open-marine setting, whereas diverse shallow benthos or transported skeletal debris may indicate platform-derived input. The plate therefore constrains a depositional system only through taphonomic and facies integration.
mapping-4-30
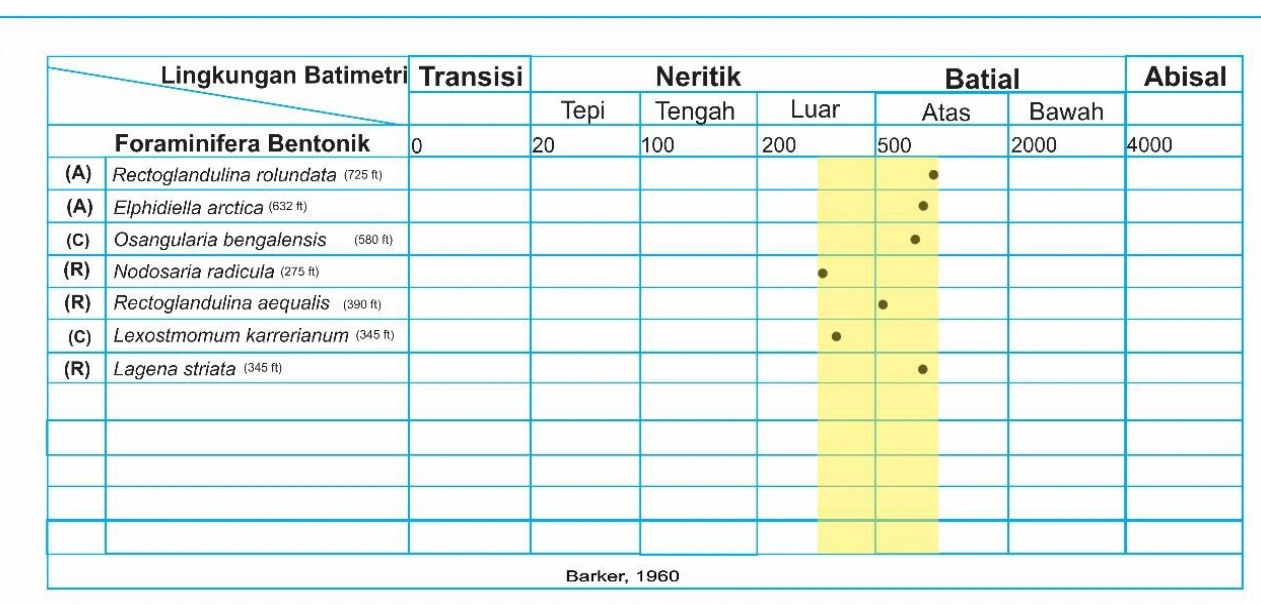
The LP51 palaeobathymetric synthesis is a model output whose uncertainty is inherited from taxonomy, ecological range and transport history. The displayed overlap should be recalculated with abundance weighting and a leave-one-taxon-out test so reviewers can see whether one questionable identification controls the result. Carbonate microfacies supplies an independent check, but diagenesis and downslope redeposition can decouple texture from original water depth. The correct conclusion is a ranked environmental interval with stated alternatives, not an exact palaeodepth. Agreement among benthic ecology, planktonic proportion, wackestone fabric and mapped basin position would justify higher confidence; discordance is evidence to investigate rather than suppress.
mapping-4-31
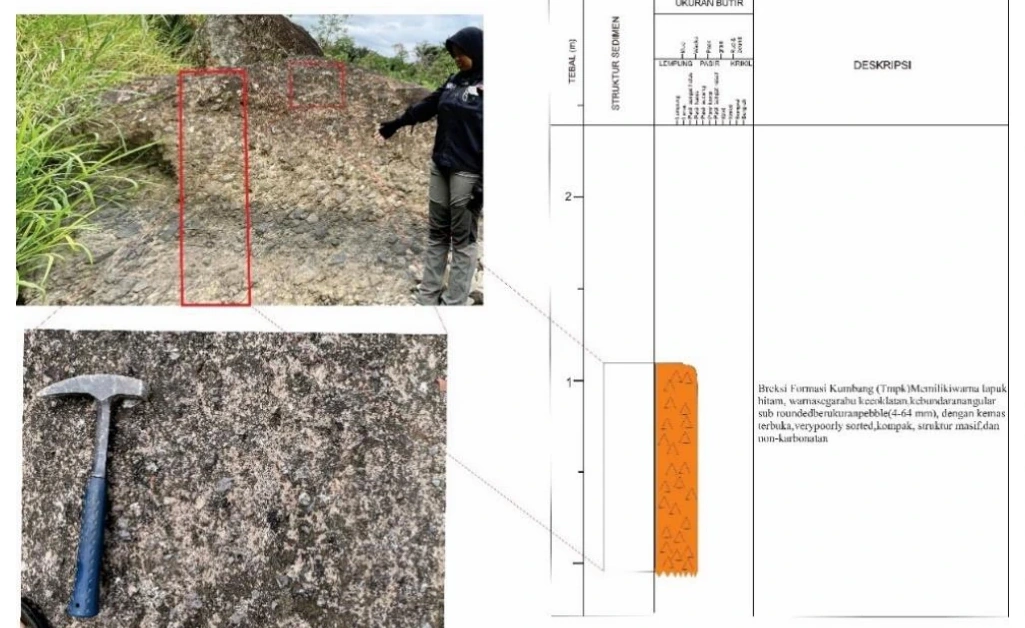
The LP80 exposure contains coarse, poorly sorted volcanic material compatible with volcaniclastic breccia, but classification requires quantitative texture and component data. Clast angularity, size distribution, matrix proportion, grading, imbrication, internal stratification and lithologic diversity should be measured, while contacts indicate whether deposition was channelised, debris-flow dominated, primary pyroclastic or reworked epiclastic. If clasts become rounded or matrix proportions vary substantially, ‘breccia-conglomerate’ may be more accurate at some stations. The plate supports high-energy mass transport of volcanic detritus; it does not by itself determine eruption mechanism, source distance or formal Kumbang assignment. Those require regional continuity, petrography and map-scale contact relationships.
mapping-4-32
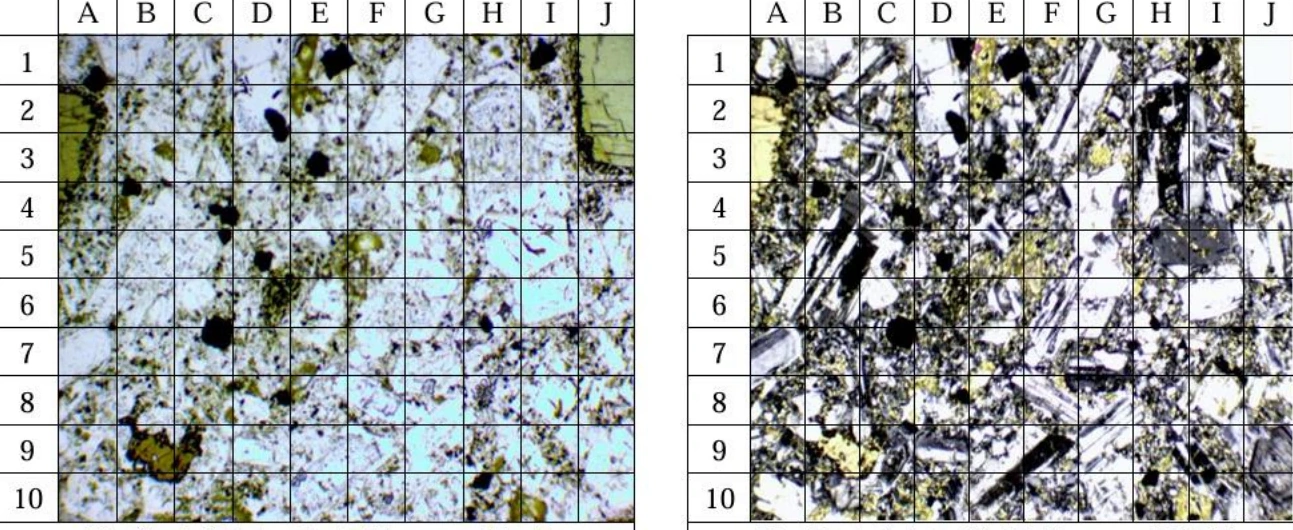
The analysed LP80 clast plots in the andesite field after QAP normalisation and shows a porphyritic, plagioclase-rich volcanic texture, supporting an intermediate volcanic source for that clast. It cannot classify the entire coarse body because a breccia may be polymictic and matrix composition may differ from clasts. The petrographic report should state point-count method, alteration effects, whether groundmass was excluded from QAP recalculation and how quartz or feldspar were identified. A representative provenance interpretation requires counts from multiple clasts and the matrix across several stations. The plate therefore provides a secure clast-scale compositional datum and a hypothesis of andesitic source terrain, not a formation-wide compositional proof.
mapping-4-33
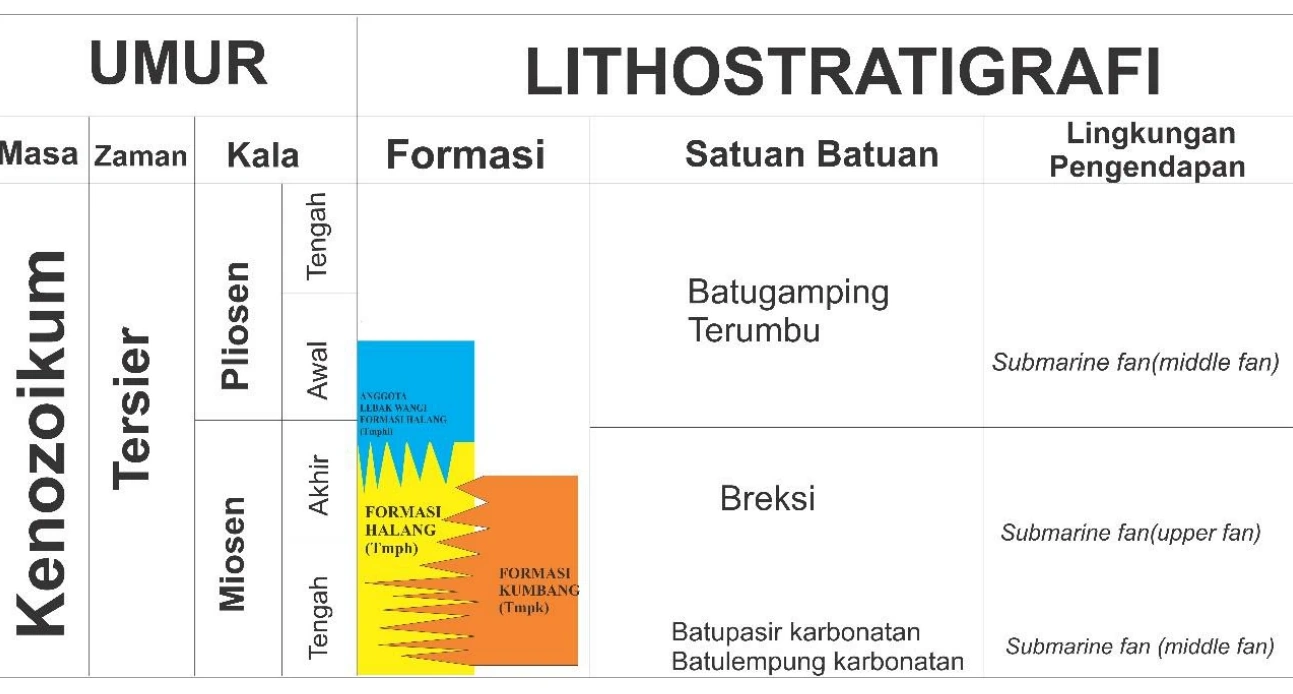
The lithostratigraphic framework is a synthesis of mapped units, fossil ages and inferred relationships, so it should visually separate observed contacts, inferred contacts, age constraints and regional correlation. Halang, Lebakwangi and Kumbang units may exhibit lateral interfingering, diachronous boundaries or structural juxtaposition; arranging them as a simple vertical stack can imply superposition not demonstrated in the field. The framework should be tested against contact exposures, younging directions, cross-section geometry and fossil intervals with their uncertainties. Its scientific value is integrative rather than evidential: it is the current model that must explain all observations while remaining revisable where control is sparse. Alternative correlation scenarios should be retained if the data do not discriminate them.
mapping-4-34
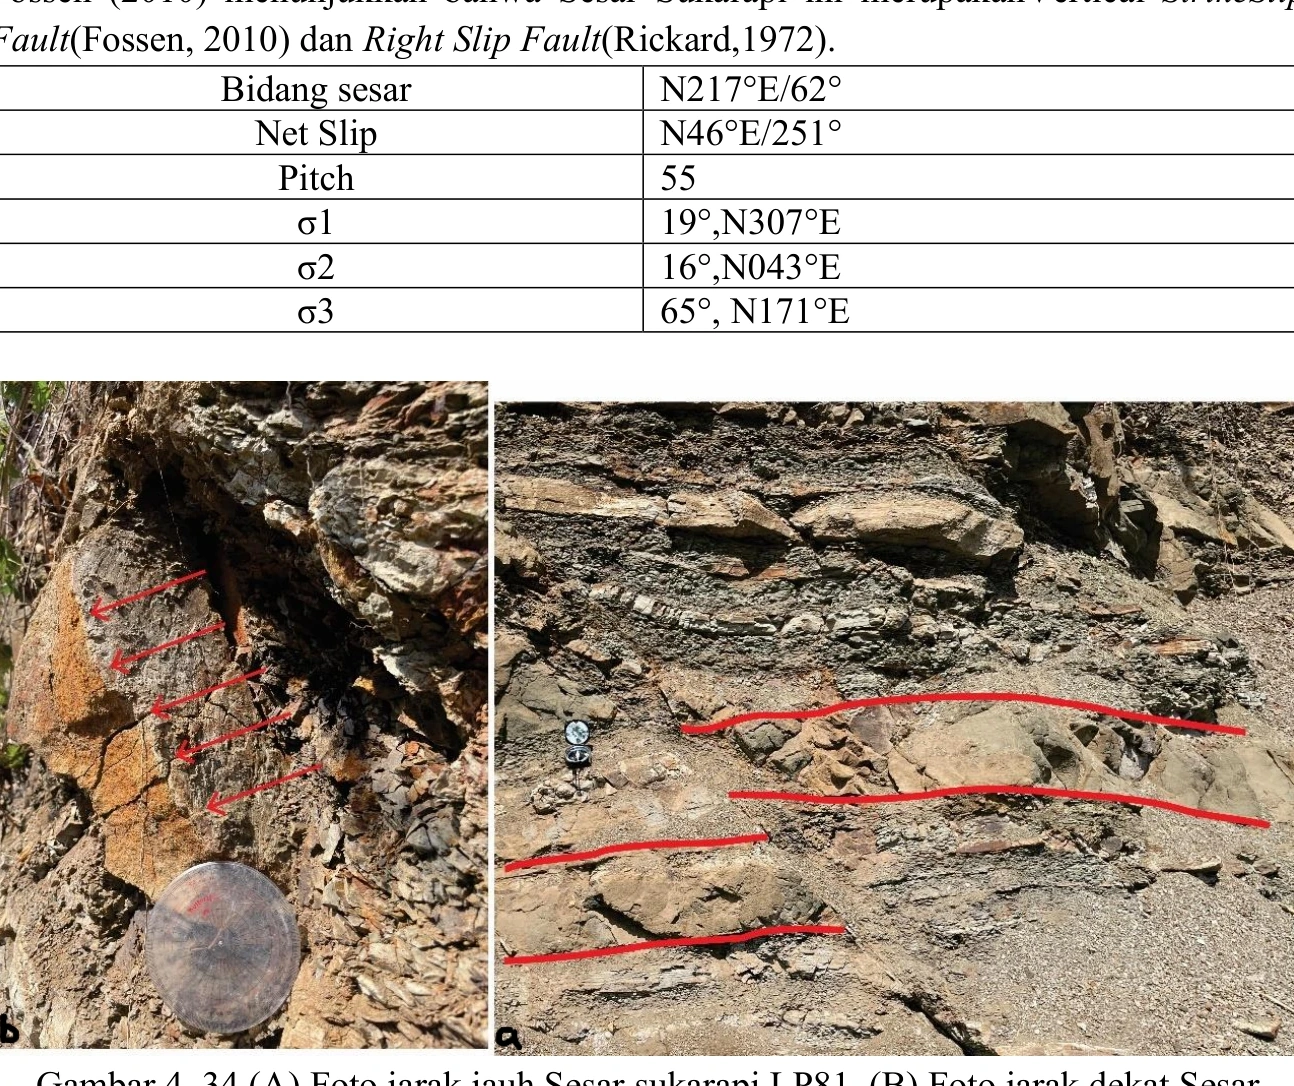
The LP81 Sukarapi exposure and slickenside are the most direct local indicators of brittle deformation, linking a discrete surface to disrupted host bedding. Kinematic interpretation requires fault-plane strike and dip, slickenline trend or rake, reliable shear-sense indicators, weathering checks and separation of one surface from the wider damage zone. A red annotation or apparent offset in a two-dimensional photograph is insufficient to establish dextral motion because perspective, erosion and bed geometry can mimic displacement. The defensible outcome is a documented fault surface with measured lineation and associated damage; movement sense remains conditional until multiple independent indicators and map-scale offsets agree.
mapping-4-35
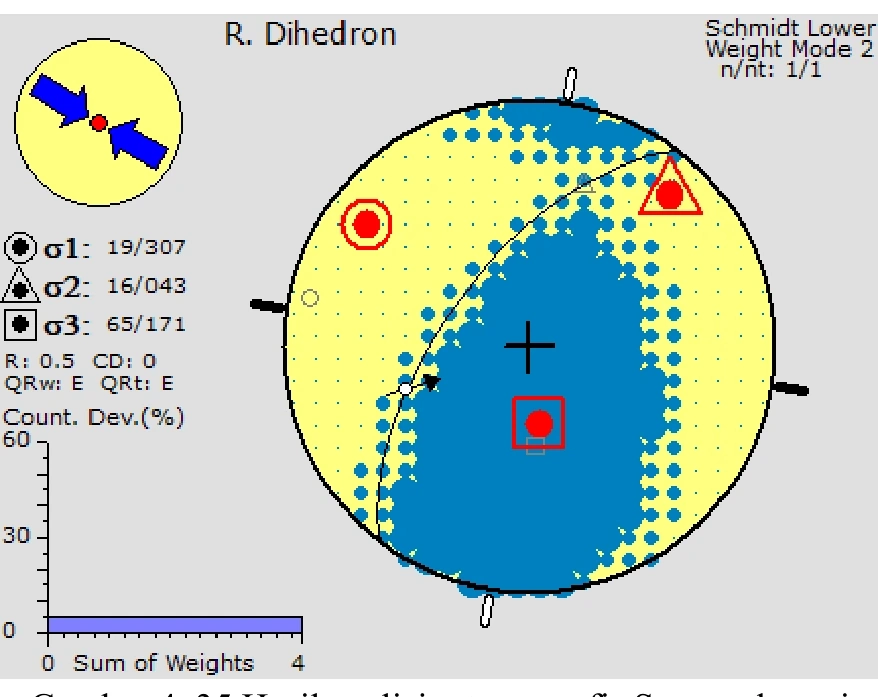
The stereographic solution translates the Sukarapi measurements into a three-dimensional kinematic hypothesis, but the input notation and projection conventions must be auditable. Plane strike/dip, slickenline rake or trend/plunge, lower- versus upper-hemisphere projection and assumed movement sense should be listed explicitly. Calling a fault ‘vertical strike-slip’ is inconsistent with a reported dip near 62° unless the term is used broadly; oblique-slip should be considered if the lineation has a substantial dip component. Uncertainty should include measurement dispersion and alternative nodal solutions. The stereonet is valuable as a consistency test between field geometry and regional structure, not as a substitute for shear-sense evidence.
mapping-4-36
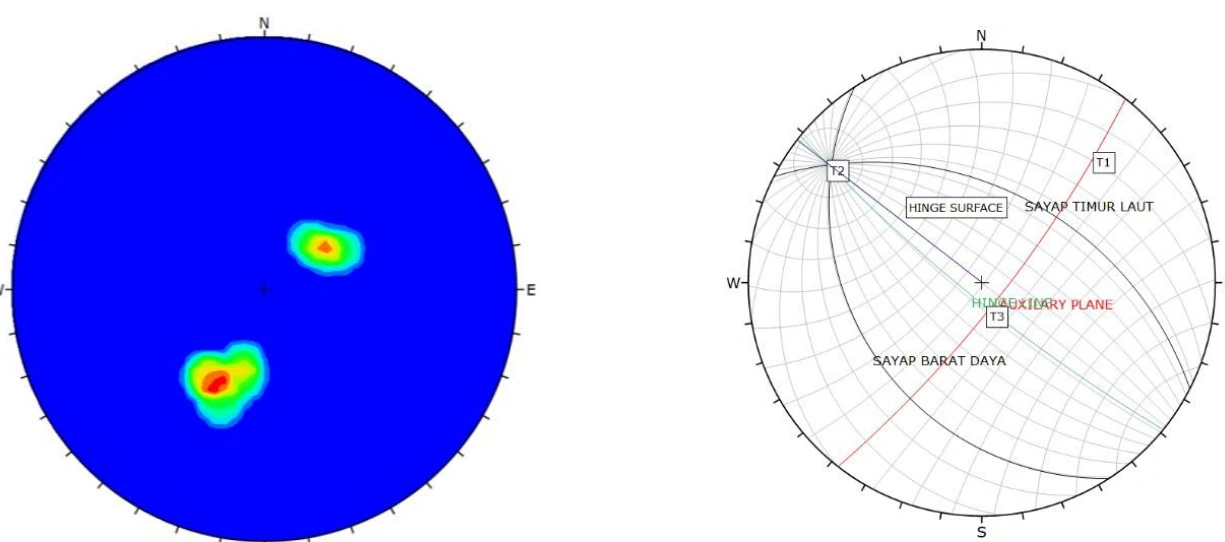
The anticline stereonet can estimate a fold axis from bedding poles only when the dataset samples both limbs adequately and poles define a statistically meaningful girdle. The plate should report the number of attitudes, limb grouping, orientation convention, best-fit great circle, calculated axis and angular confidence or dispersion. Spatial autocorrelation matters: many readings from one exposure do not equal independent regional control. The solution should predict the mapped hinge trace, plunge direction, stratigraphic repetition and cross-section geometry. If the poles form clusters rather than a girdle, a cylindrical fold model may be inappropriate. The figure is therefore a quantitative hypothesis whose strength depends on transparent sampling and map-level validation.
mapping-4-37
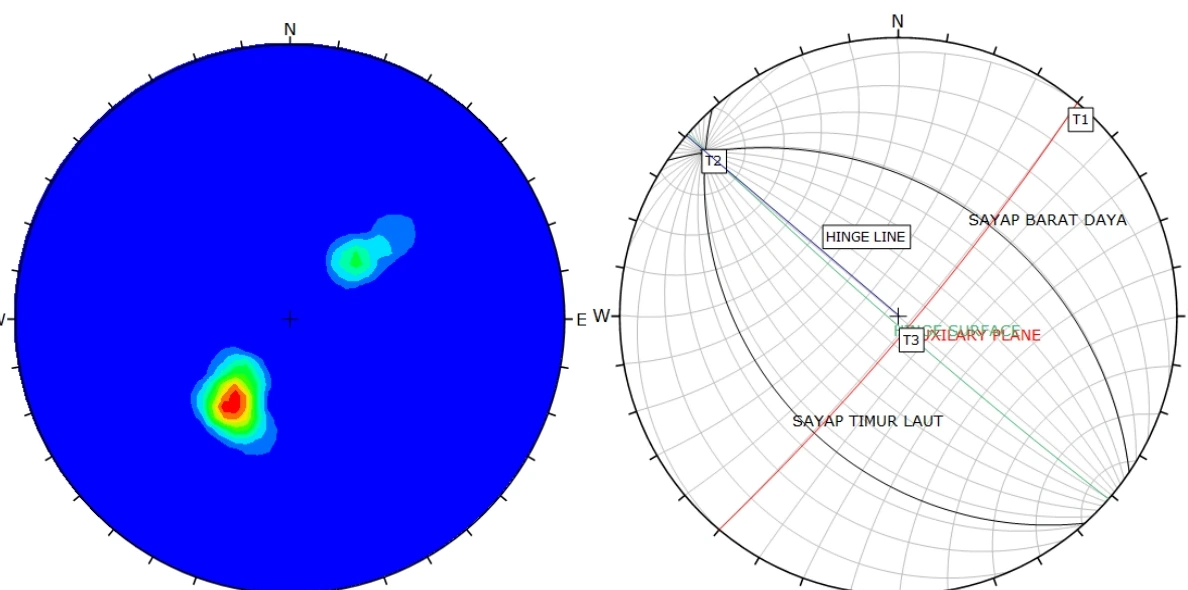
The syncline stereonet requires the same discipline as the anticline analysis: balanced limb sampling, consistent right-hand-rule notation, a defensible girdle fit and an uncertainty measure for the calculated fold axis. Local drag near faults or bedding rotation within damage zones can bias regional fold geometry, so structurally disturbed readings should be identified and sensitivity-tested rather than silently pooled. The derived axis should align with mapped closures and the geological cross-section within measurement error. Where it does not, non-cylindrical folding, multiple deformation phases or misassigned limb data become credible alternatives. The stereonet should expose that diagnostic tension rather than present a single exact orientation as self-validating.
mapping-4-38
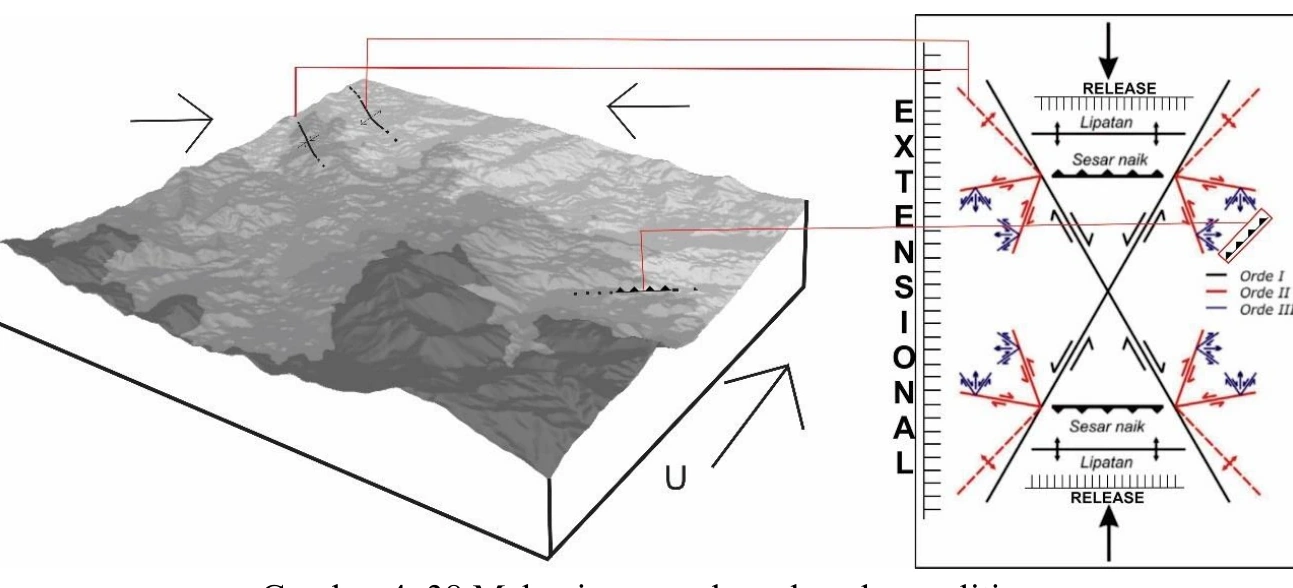
The conceptual structural mechanism explains how folding and faulting might coexist, but it is a causal model rather than a direct observation. Its usefulness depends on explicit predictions: expected fault orientation and slip, fold vergence, strain localisation, bed rotation and cross-cutting relationships. Those predictions should be compared with the Sukarapi fault data, fold-axis solutions, mapped contacts and damage-zone photographs. Multiple tectonic histories—including progressive transpression, reactivation or separate deformation episodes—may produce similar present geometry. The diagram should therefore be labelled as a working mechanism with alternatives and falsification criteria. A compelling synthesis is not the most elaborate story; it is the simplest model that survives independent structural observations.
mapping-4-39
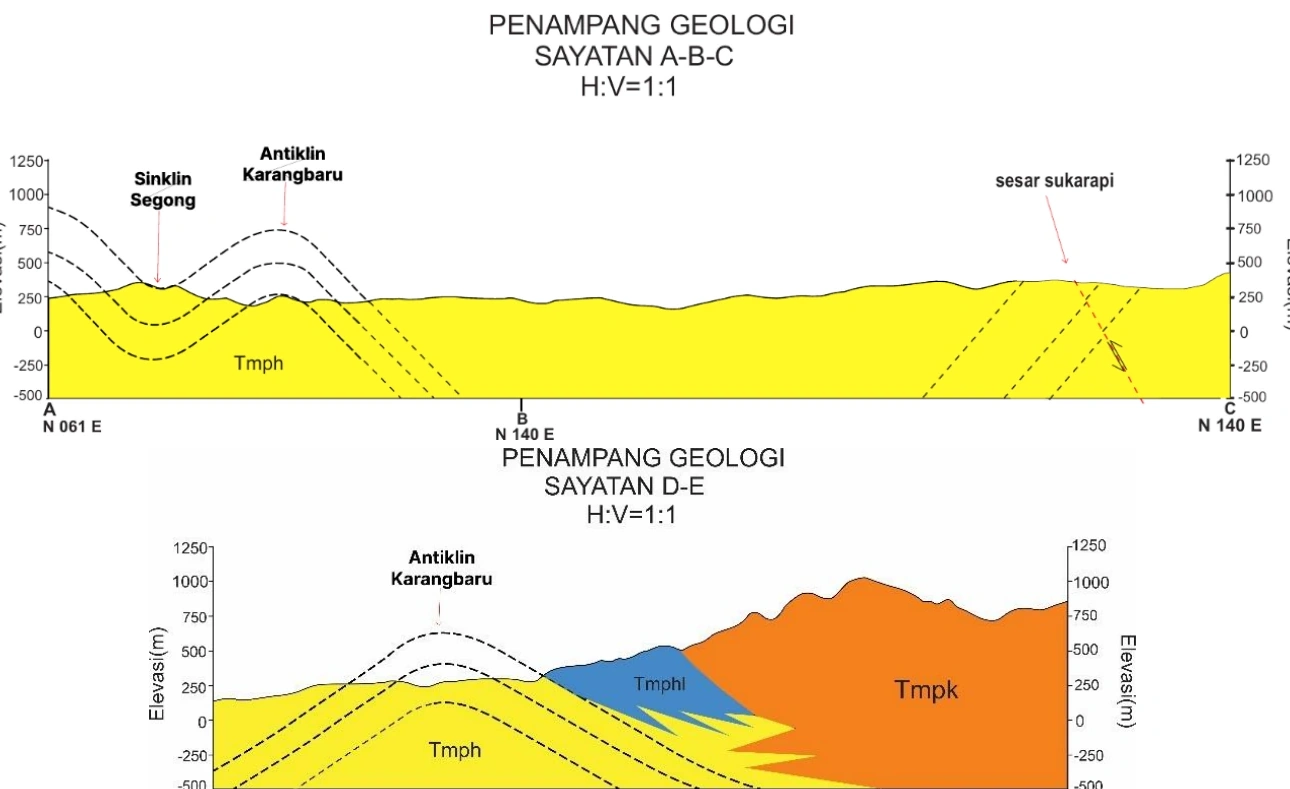
The geological cross-section is the project’s principal integration test because every contact, attitude, fold and fault must coexist geometrically beneath measured topography. Audit priorities are the exact section trace, projection distance of off-line data, conversion of apparent to true dip, thickness consistency, placement of inferred boundaries and whether fault offsets and fold limbs honour map patterns. Areas without control should be visibly distinguished from data-constrained geometry. A balanced or at least length-consistent reconstruction would add confidence, while alternative sections should be considered where subsurface data are absent. The section is therefore not a decorative summary: it is a falsifiable model that reveals contradictions among mapping, stereographic analysis and stratigraphic assumptions.
TECHNICAL APPENDICES
Source sheets containing prose only (Appendices 12, 15 and 18) are intentionally omitted as images; their verifiable compositional information is integrated into adjacent visual analysis.
appendix-01
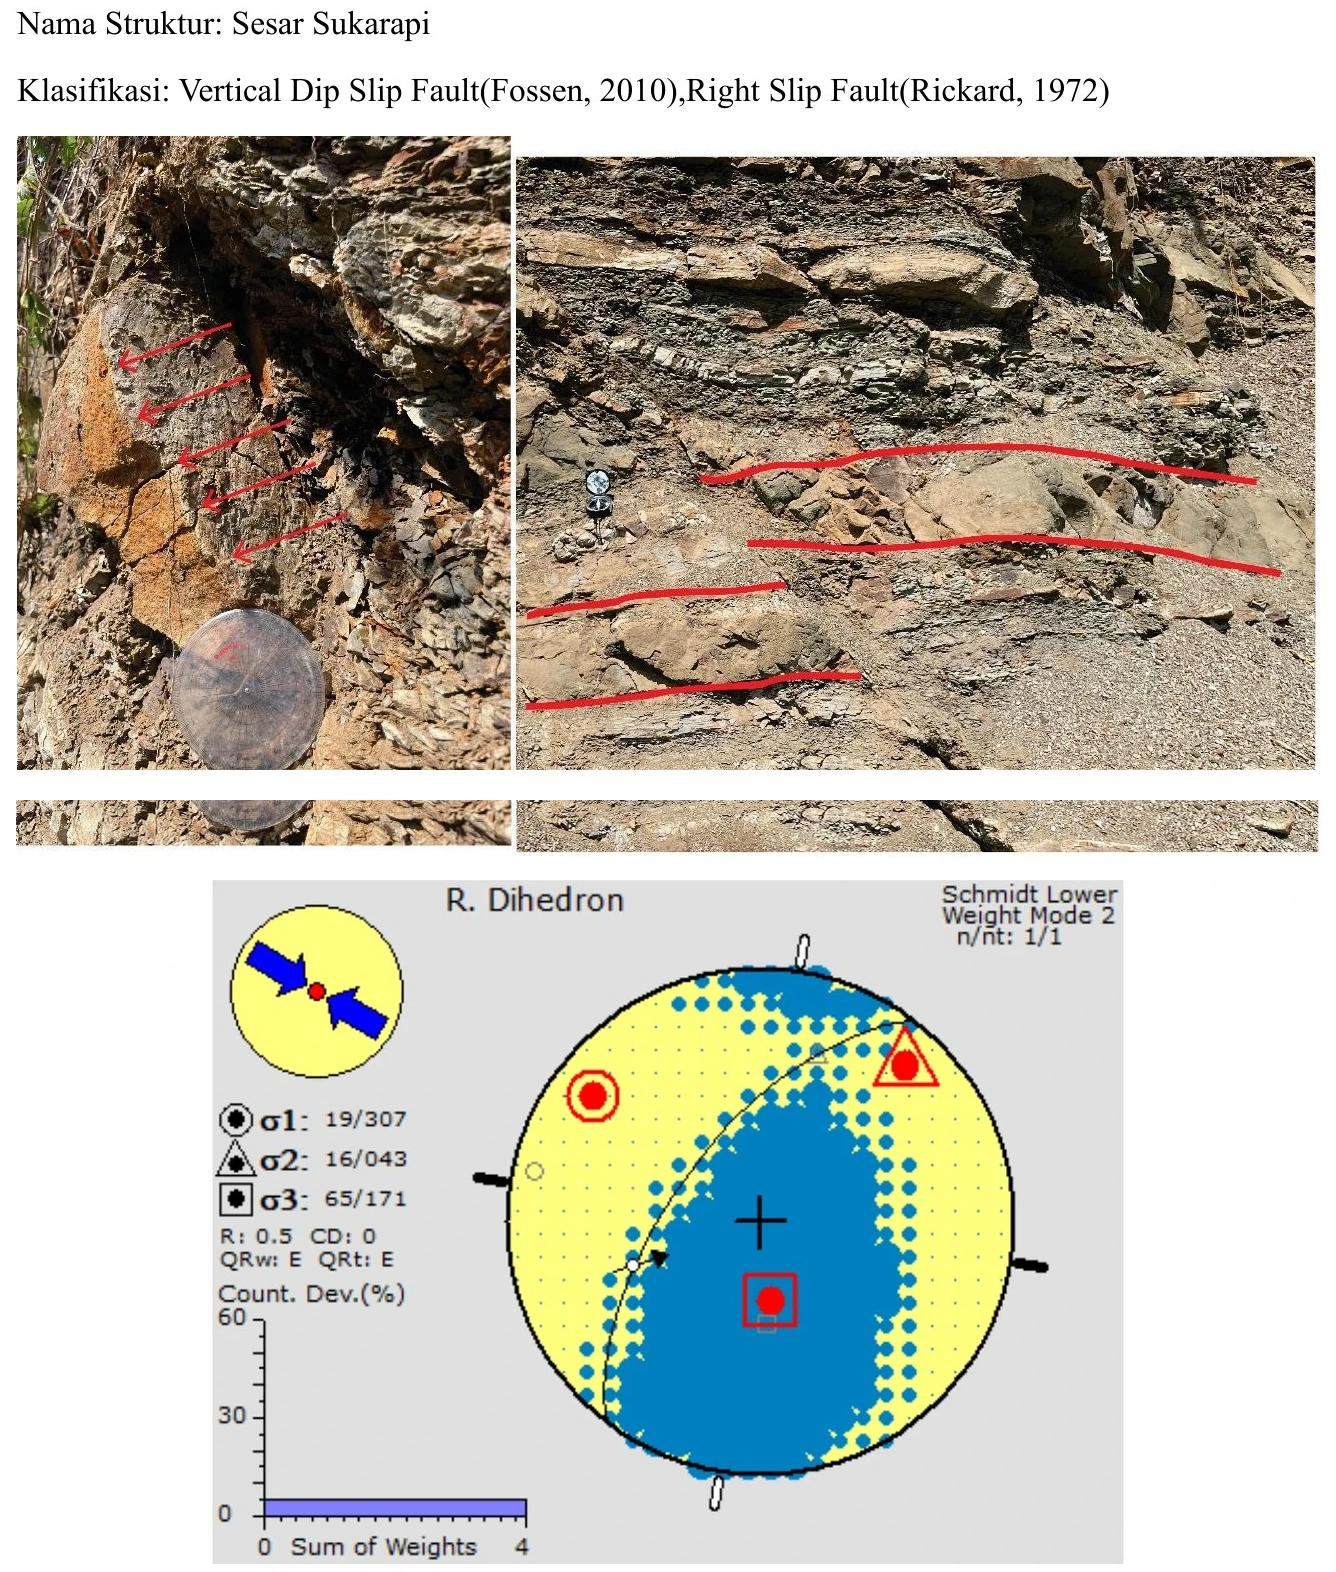
The first structural worksheet combines field photographs, traced discontinuities and a stereographic plot, creating a useful chain from exposure to orientation analysis. The principal audit question is whether every plotted plane and line corresponds to a traceable measurement rather than an interpretive line drawn after the fact. Orientation convention, hemisphere, sample count and the distinction between bedding, joint, fault plane and slickenside must be explicit. Cluster density can reveal preferred fabrics, but weathering surfaces and repeated readings from one exposure can artificially tighten a mode. This sheet is strongest as provenance for the structural dataset; kinematic conclusions require independent shear-sense evidence and map-scale continuity.
appendix-02
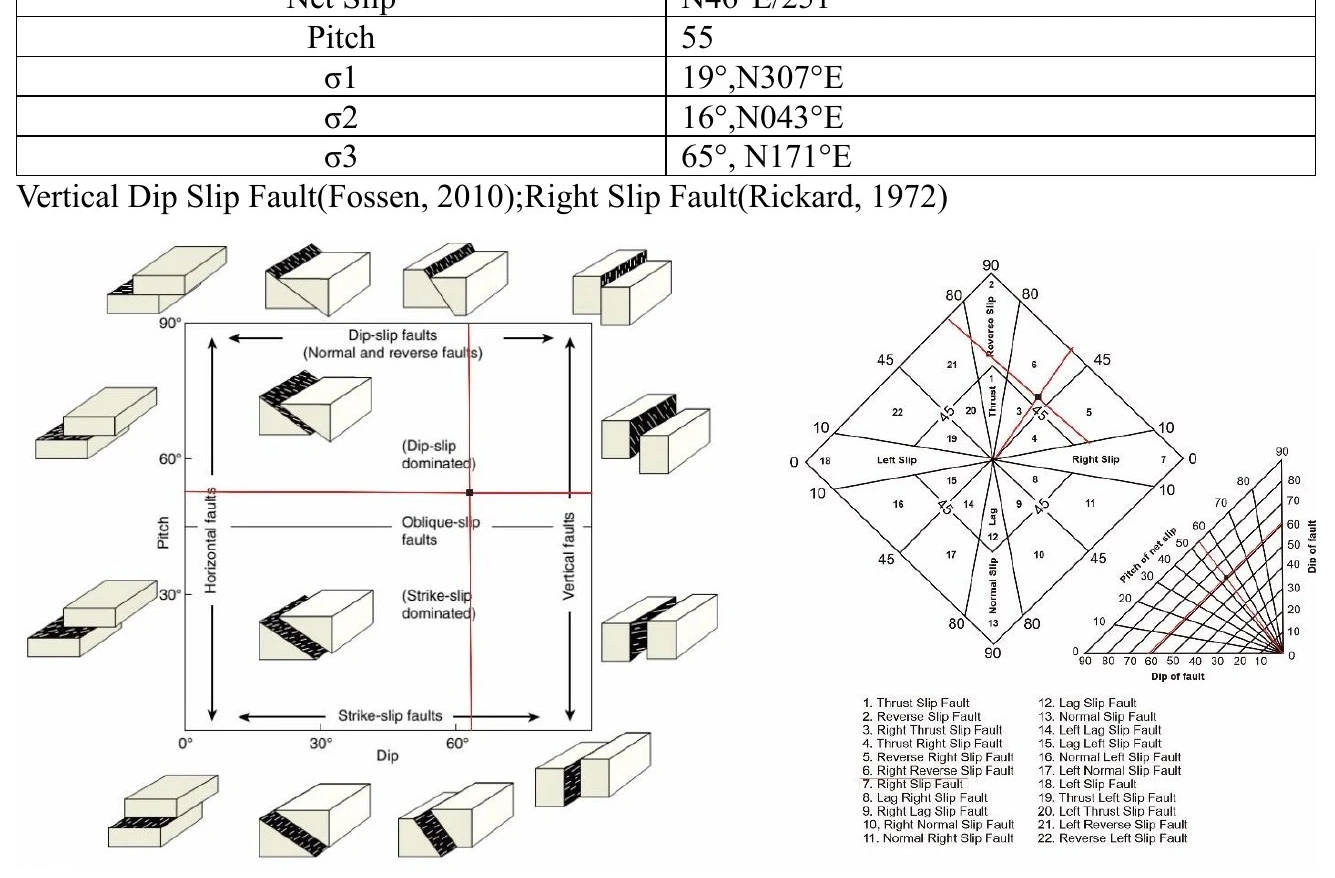
The worksheet juxtaposes a tabulated plane and lineation with a classification of dip-slip geometries and a directional distribution plot. That structure makes the reasoning auditable, provided the field notation is converted consistently and the rake is measured on the stated fault plane. Class names should follow the measured slip vector rather than the apparent movement in an oblique photograph. The rose or stereographic distribution is descriptive until uncertainty and sample independence are reported. A robust conclusion would reproduce the plotted point from the tabulated values, test alternative quadrants and confirm the interpreted motion using at least two physical indicators such as steps, mineral fibres, drag or displaced markers.
appendix-03
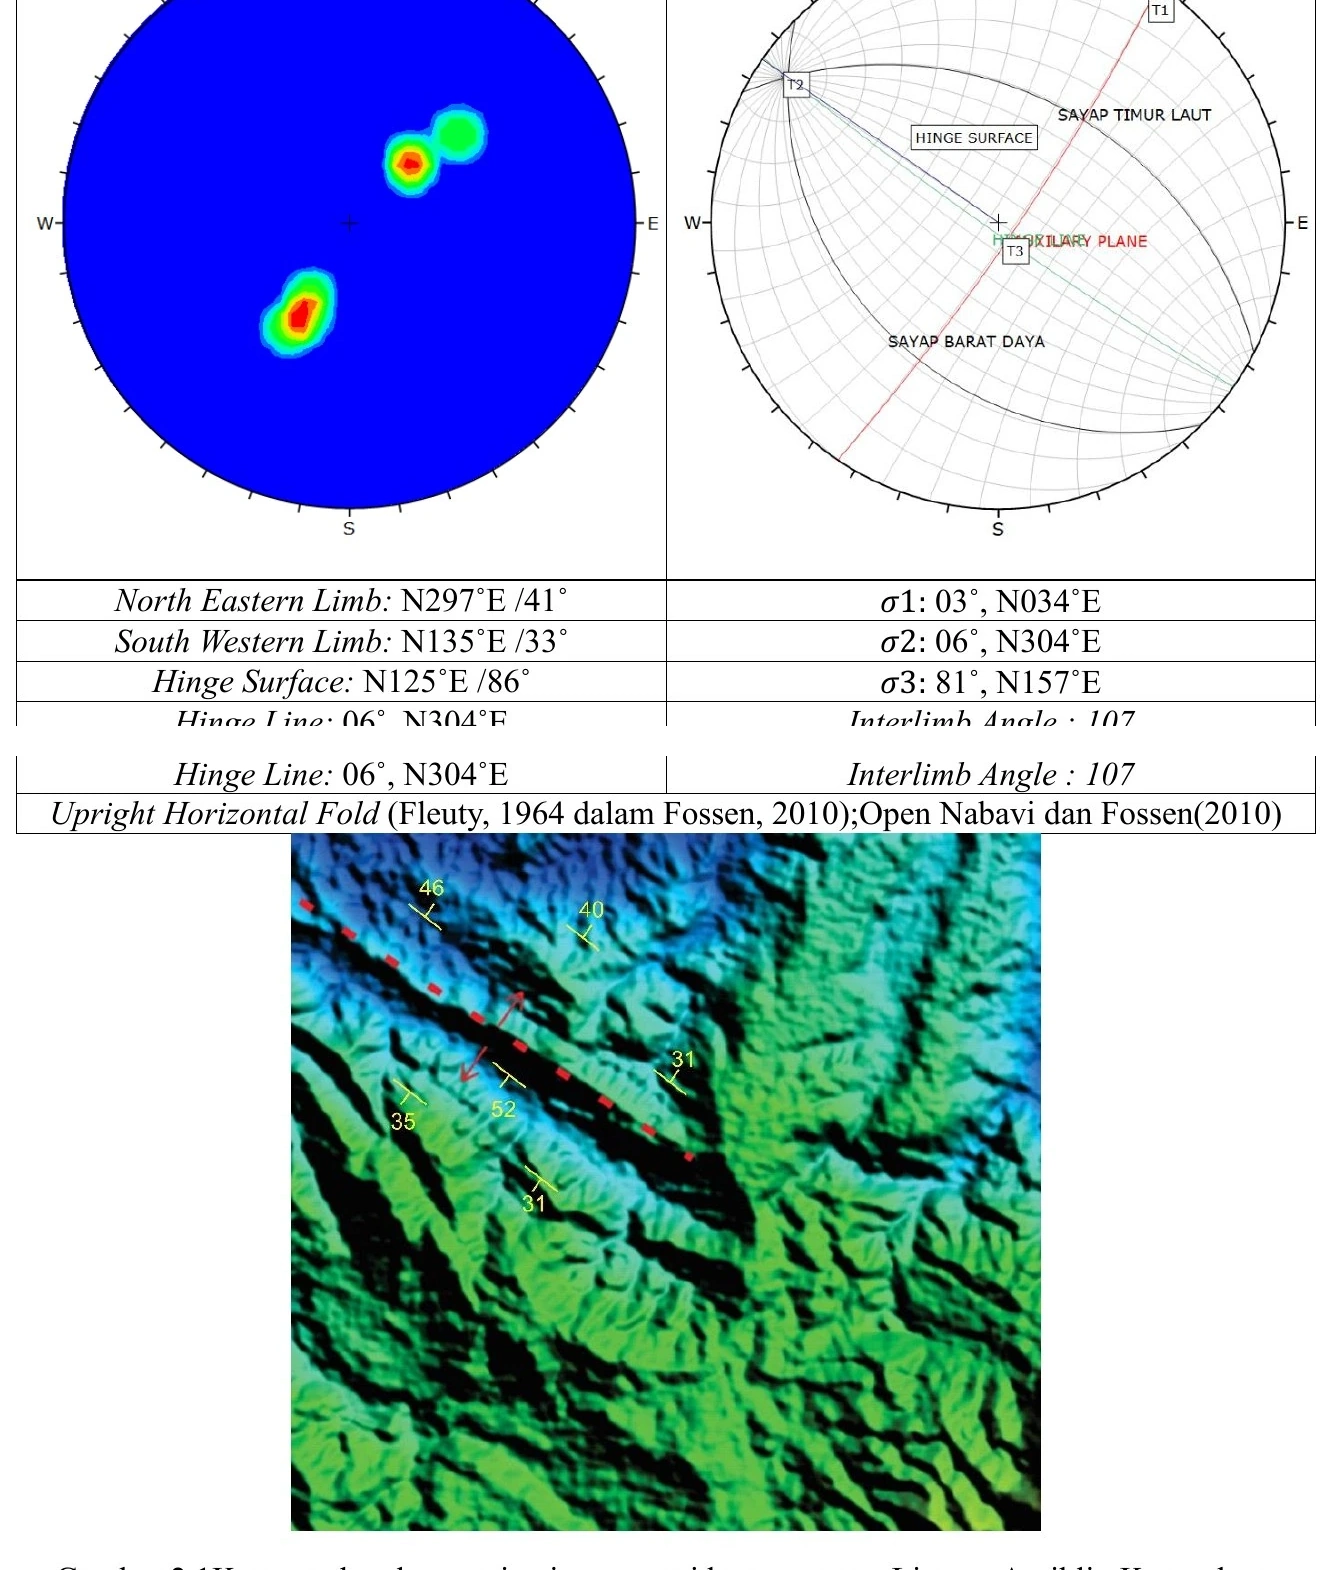
The combination of pole-density stereonet, rose diagram and shaded relief tests whether structural orientations have a landscape expression. Alignment is meaningful only if the datasets are independent: the DEM lineaments should be extracted without reference to the measured fault set, then compared statistically rather than visually. Scale and azimuthal sampling bias must be considered because illumination, drainage and ridge length influence apparent lineament frequency. If the dominant topographic and field orientations coincide beyond a null expectation, the result supports structural control; if not, lithology or drainage inheritance may dominate. The sheet should therefore be read as a multi-dataset correlation test, not as proof that every linear landform is a fault.
appendix-04
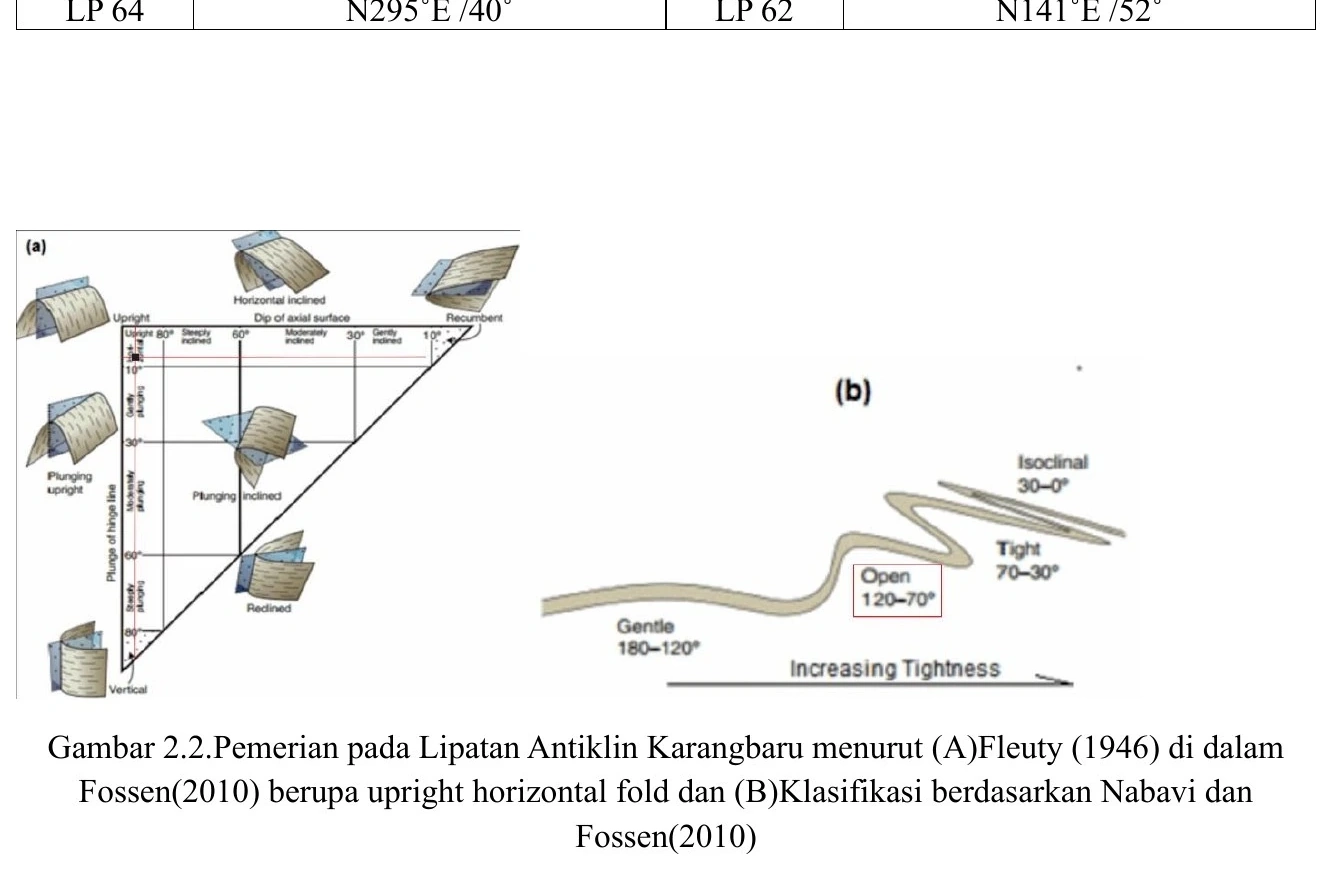
The fold-analysis sheet organises limb attitudes and applies a cylindrical-fold construction to estimate a hinge or fold axis. Its validity depends on correct identification of the two limbs, exclusion or separate treatment of fault-dragged beds, and adequate coverage along the mapped fold. A single idealised Fleuty-style diagram is a classification aid, not evidence of the local geometry. The observed poles should form a coherent girdle and the calculated axis should predict the mapped hinge orientation and plunge. Reporting sample number, dispersion and confidence would expose whether the fold is genuinely cylindrical or whether non-cylindrical geometry, multiple phases or sparse sampling require a more flexible model.
appendix-05
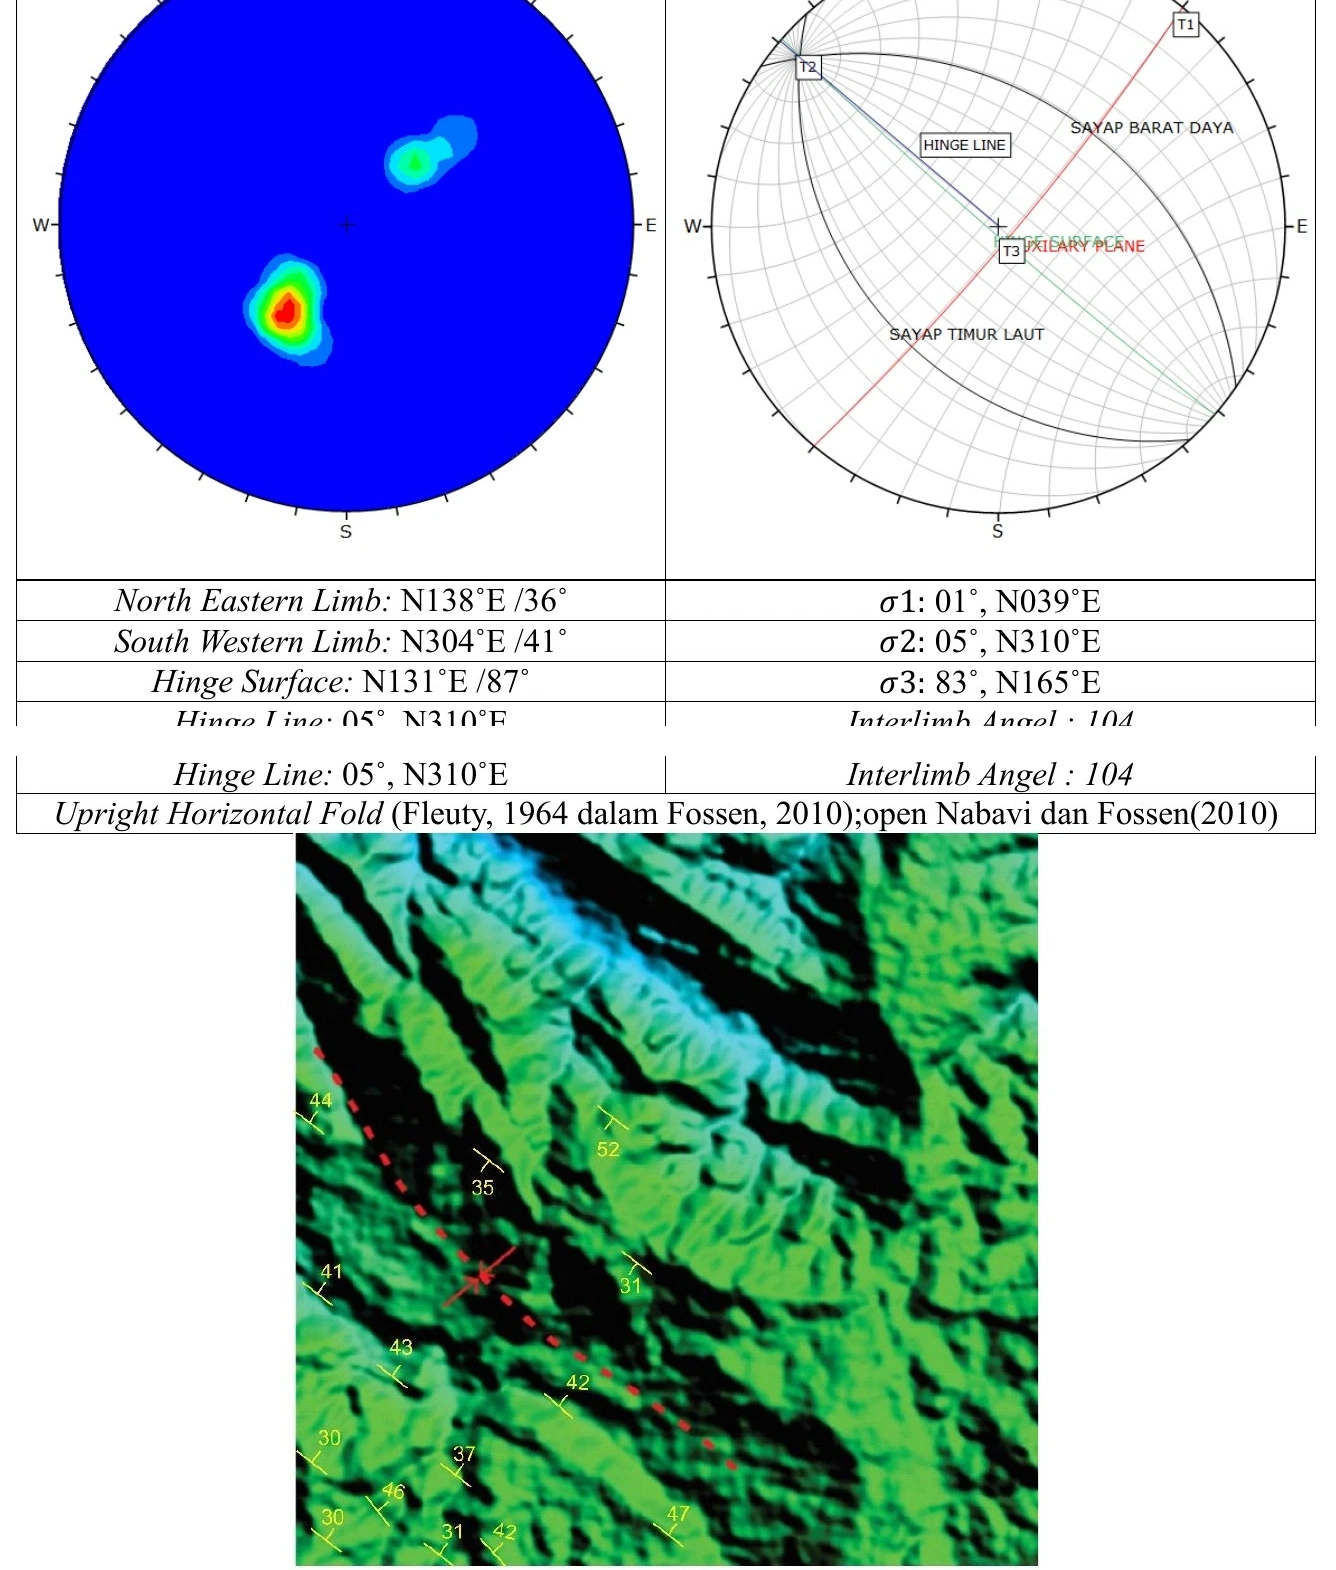
This plate couples a second fold-orientation dataset with terrain imagery, allowing the statistical solution to be checked against the mapped landscape. The comparison should remain directional rather than purely pictorial: calculate the angular difference between the fold axis, ridge or valley trend and map trace, then assess whether it lies within measurement and fitting uncertainty. Similar orientation does not prove causation because resistant beds can guide relief independently of hinge position. The strongest interpretation emerges when opposing limb dips, stratigraphic repetition, younging direction and the terrain expression all agree. Any discordance should be used diagnostically to test plunge variation, fault interference or an incorrectly assigned structural domain.
appendix-06
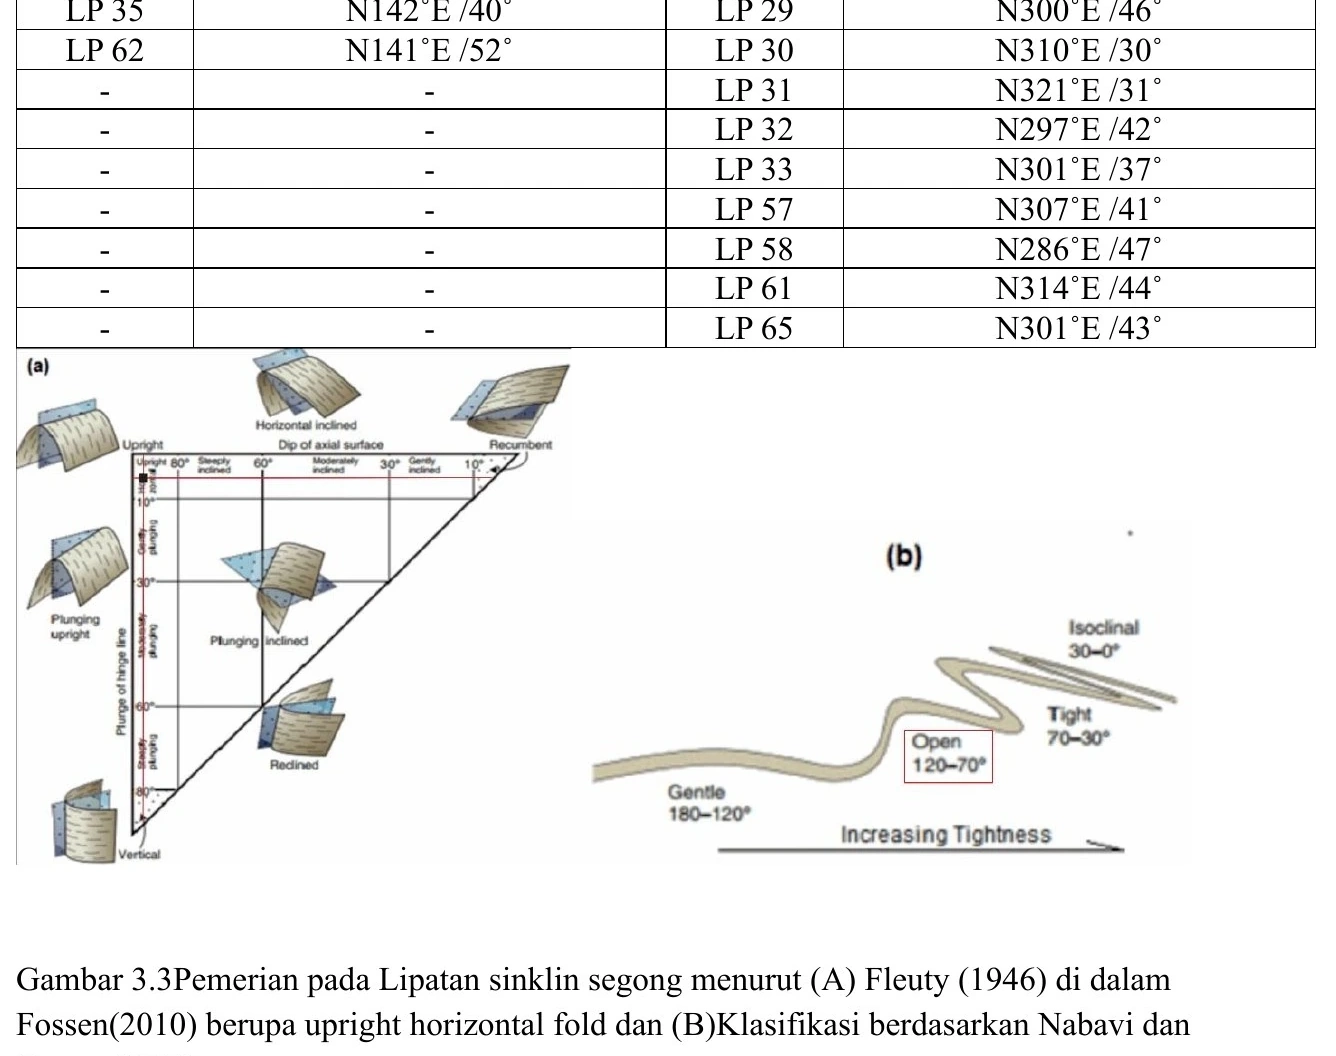
The syncline worksheet assembles numerous bedding attitudes and a conceptual classification diagram. The larger table improves regional coverage, but the analysis must prevent clustered stations from dominating the solution and should identify measurements projected from outside the section corridor. A fold-axis estimate should be accompanied by a best-fit uncertainty and tested after excluding structurally disturbed readings. The idealised geometry in the lower panel explains nomenclature only; the local fold class must come from the measured interlimb angle, plunge and symmetry. Consistency with the final map and cross-section is the decisive test, because a statistically neat stereonet can still represent a spatially incoherent mixture of domains.
appendix-07
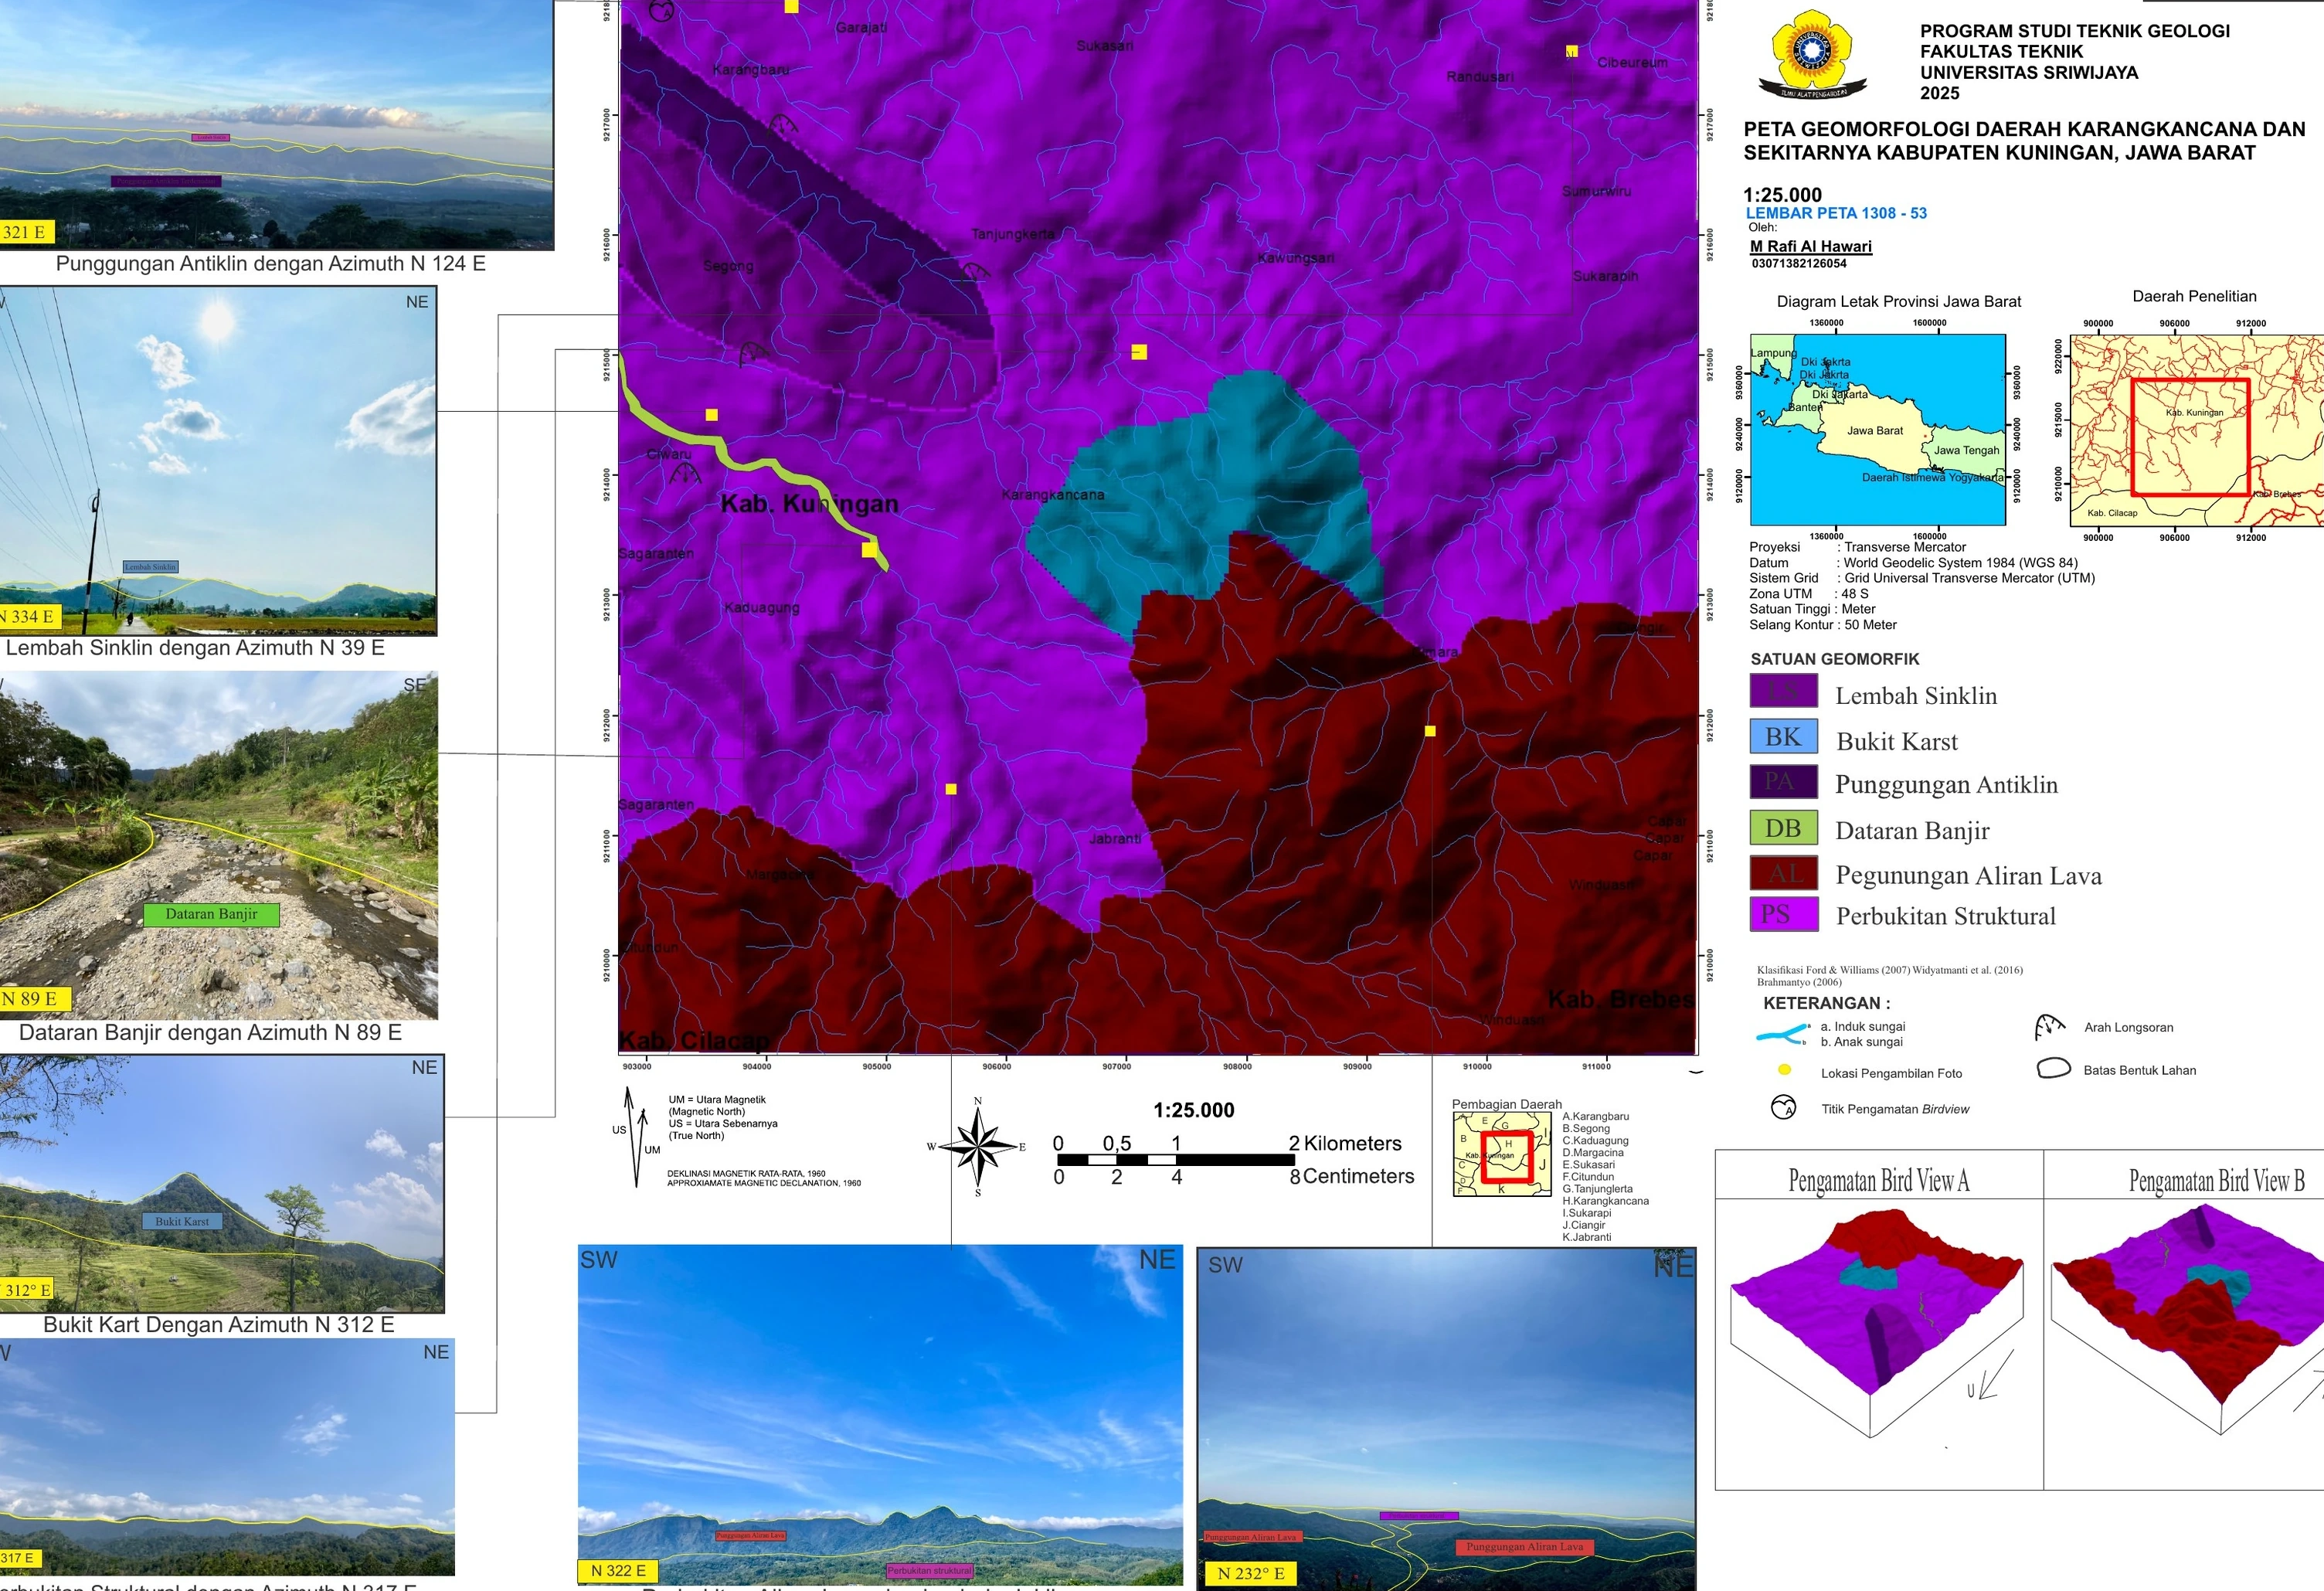
The geomorphological compilation combines terrain classes, field photographs, regional position and conceptual block views. Its principal strength is multi-scale traceability: mapped landforms can be compared with what was actually observed on the ground. The analytical hierarchy should remain explicit—DEM-derived morphology is observation, process assignment is interpretation, and structural or lithologic control is a hypothesis tested by independent mapping. Unit boundaries need reproducible criteria and transitions should be shown where form is gradual. Relief, slope, drainage and material data should be evaluated together, while photographic localities and exposure density reveal where confidence varies. This prevents visually attractive landform polygons from acquiring unjustified genetic certainty.
appendix-08
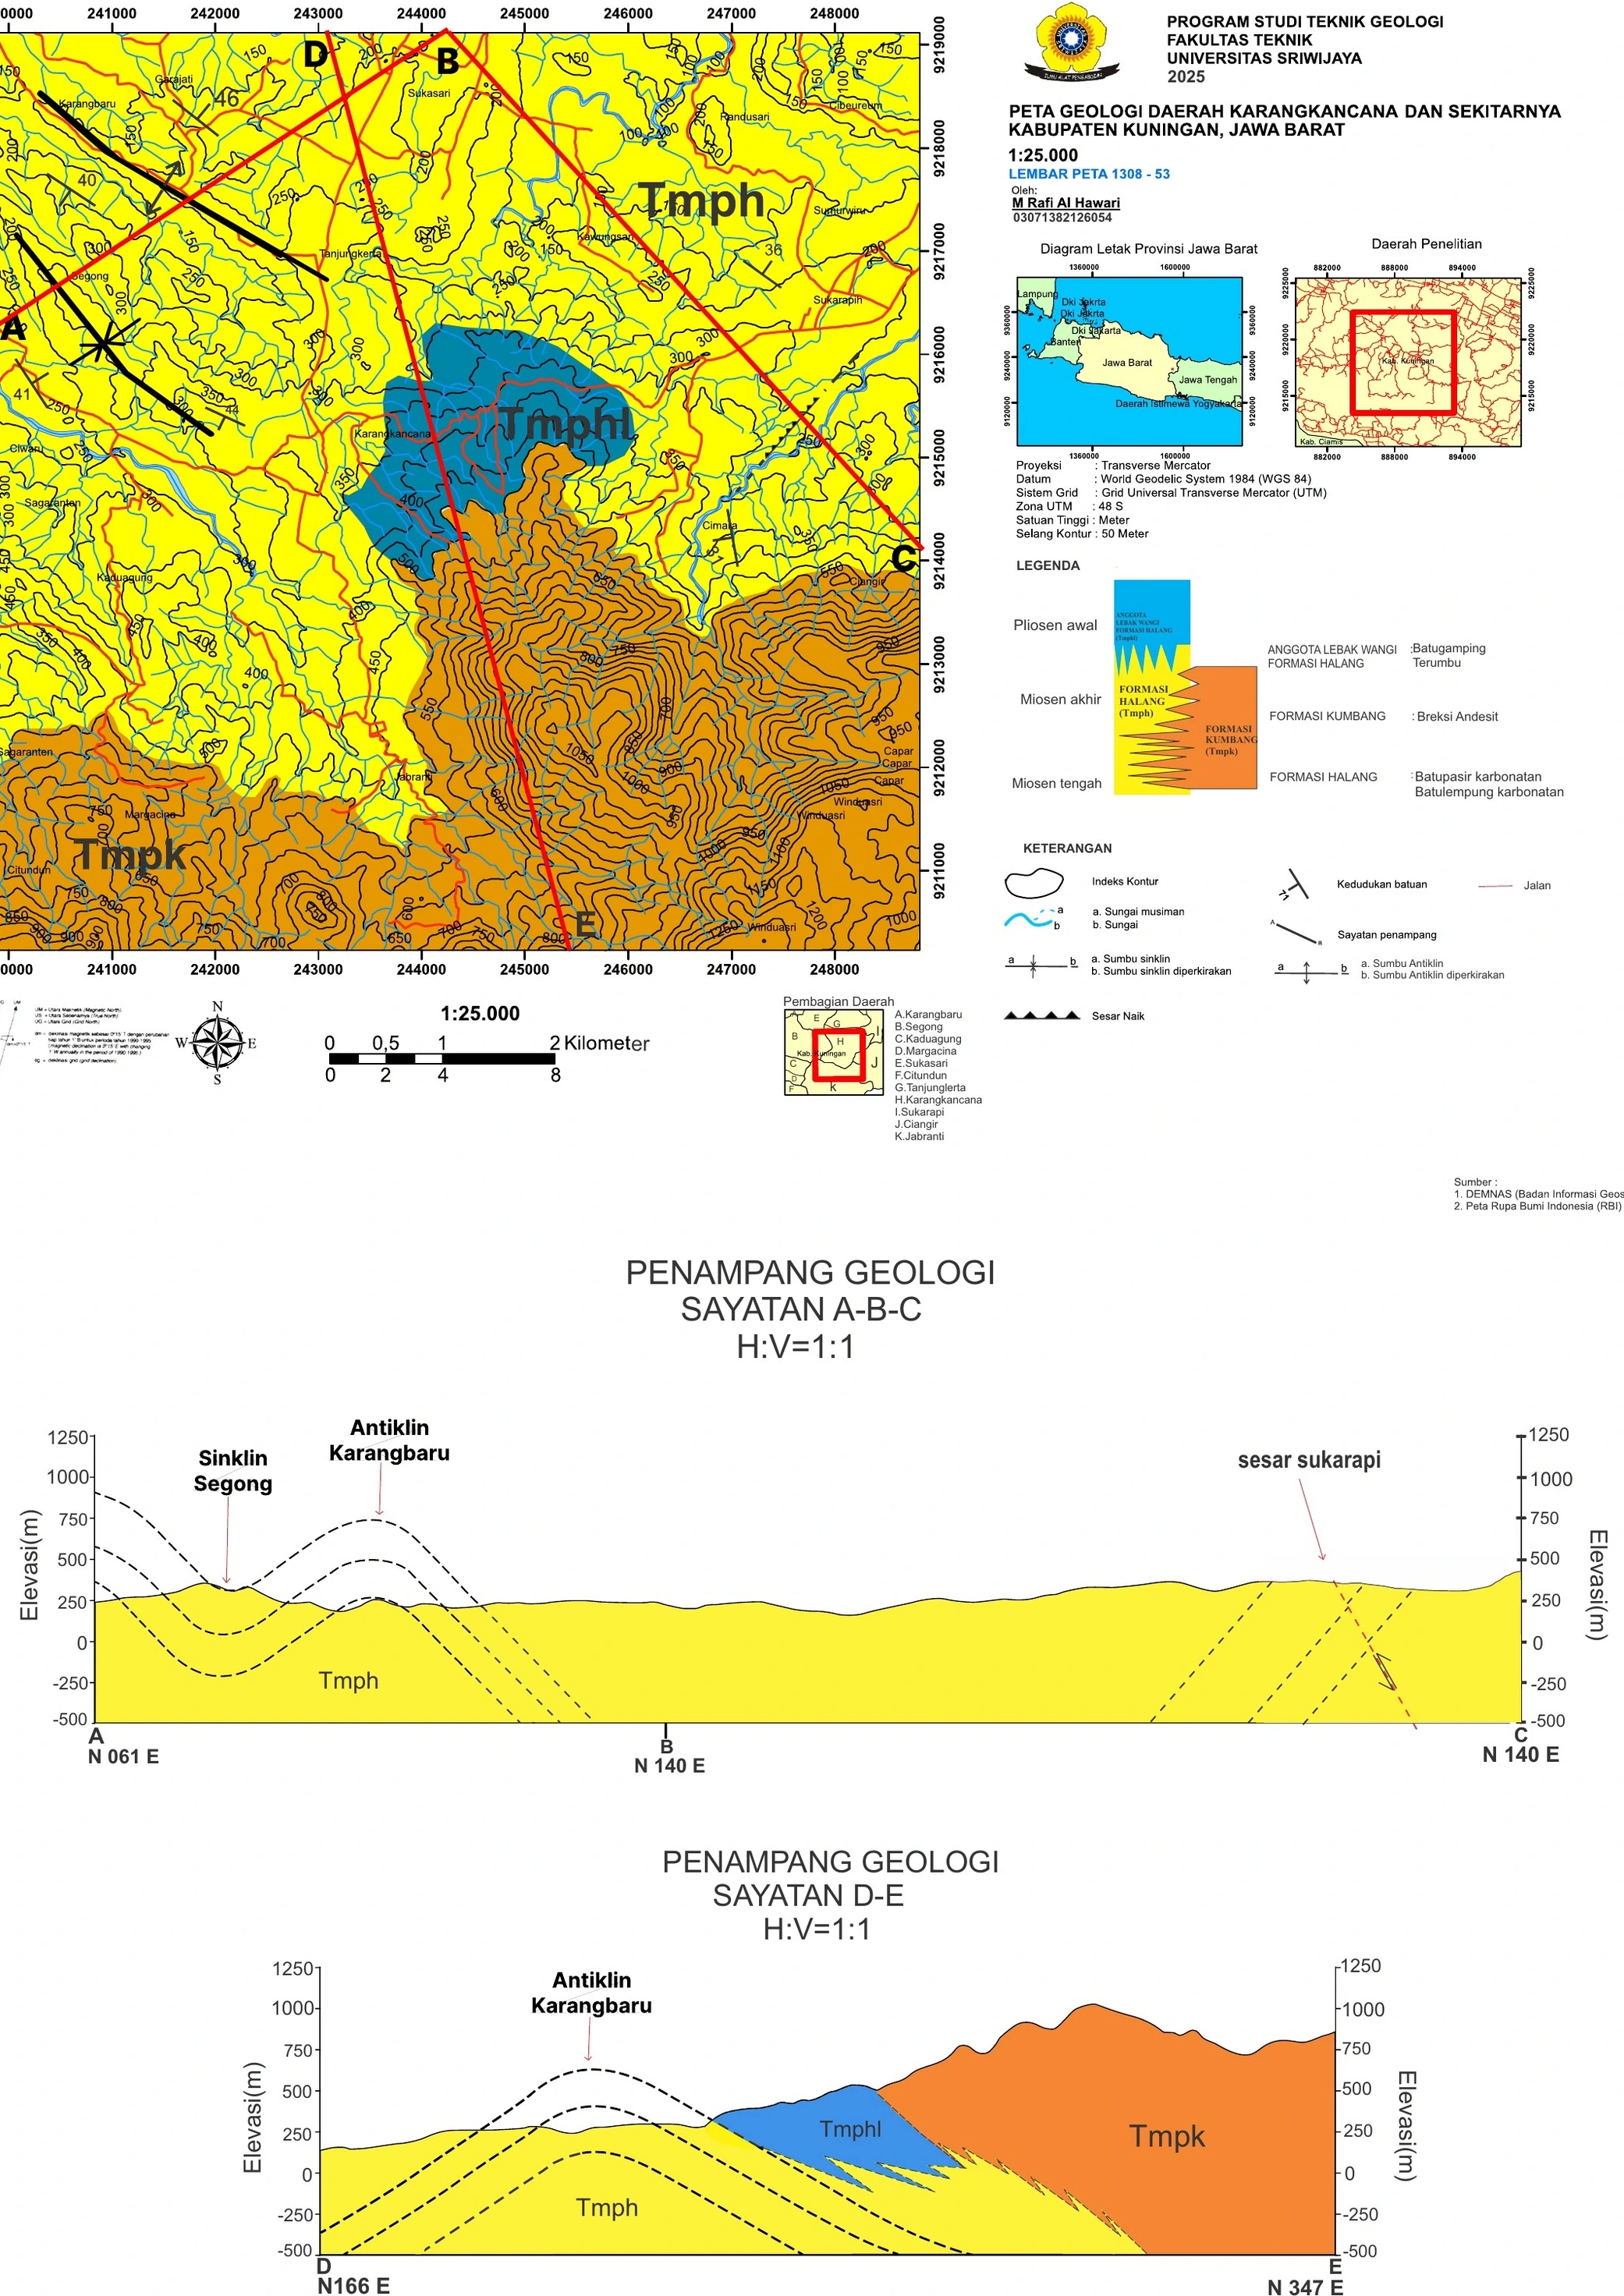
The final geological map and cross-sections are the highest-level synthesis of the survey, integrating 85 GPS-controlled stations across the 9 × 9 km area. Scientific credibility depends on cartographic completeness—CRS, scale, north, legend, contact certainty, structural symbols and section traces—and on internal consistency between every map and section relationship. Observed contacts should be distinguished from interpolated boundaries, and formations should not be ordered more precisely than fossil, petrographic and field evidence allow. The map is best evaluated by leave-one-out reasoning: ask whether the interpreted unit or structure would still be predicted if a key station were withheld. Zones with competing solutions deserve visible uncertainty rather than decorative precision.
appendix-09
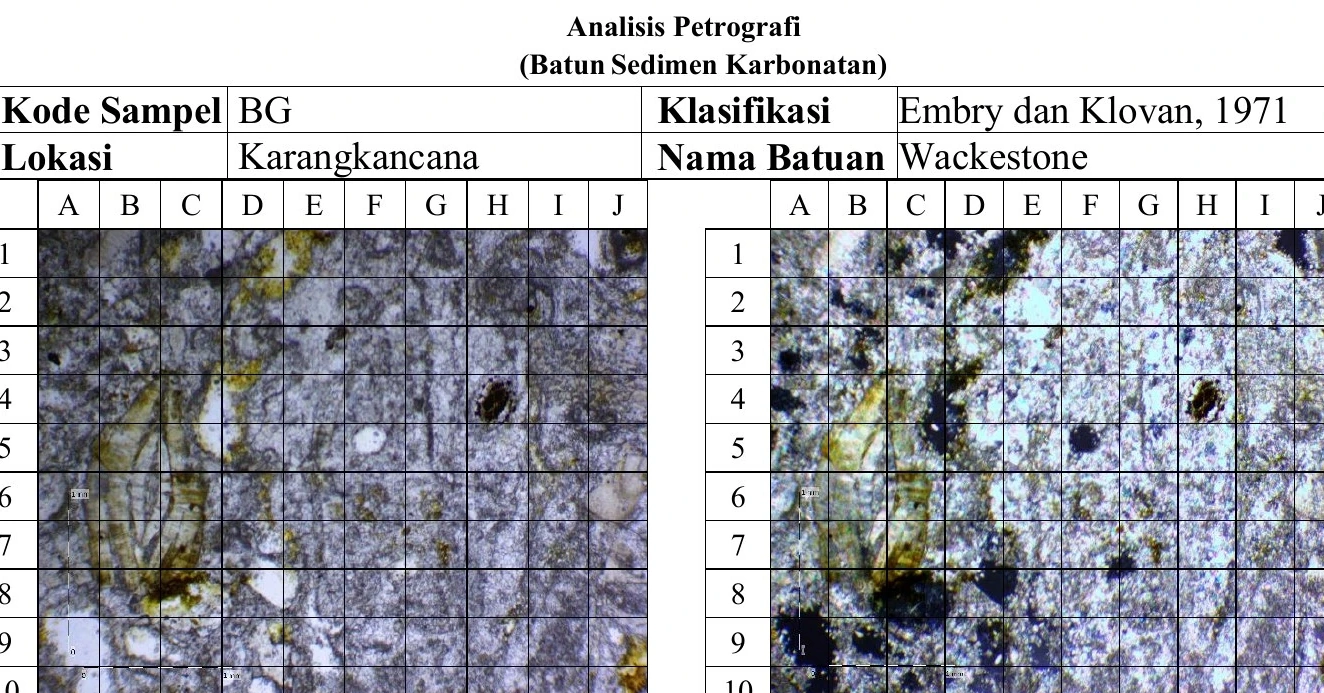
The BG thin-section plate records a matrix-supported carbonate assigned to wackestone, with reported microspar, spar, skeletal grains, pisoids and minor quartz. The classification is plausible if allochems exceed ten percent while lime mud remains load bearing, but the stated 5–15 mm grain size at 40× is almost certainly a unit or calibration error and must be corrected. Modal percentages should identify counting method and sum, while recrystallised microspar should not be mistaken for primary depositional mud. The fabric supports a relatively low-energy carbonate setting or protected microenvironment; it does not demonstrate reef framework. Diagenetic replacement, cementation and transported grains should be separated from primary microfacies before depositional interpretation.
appendix-10
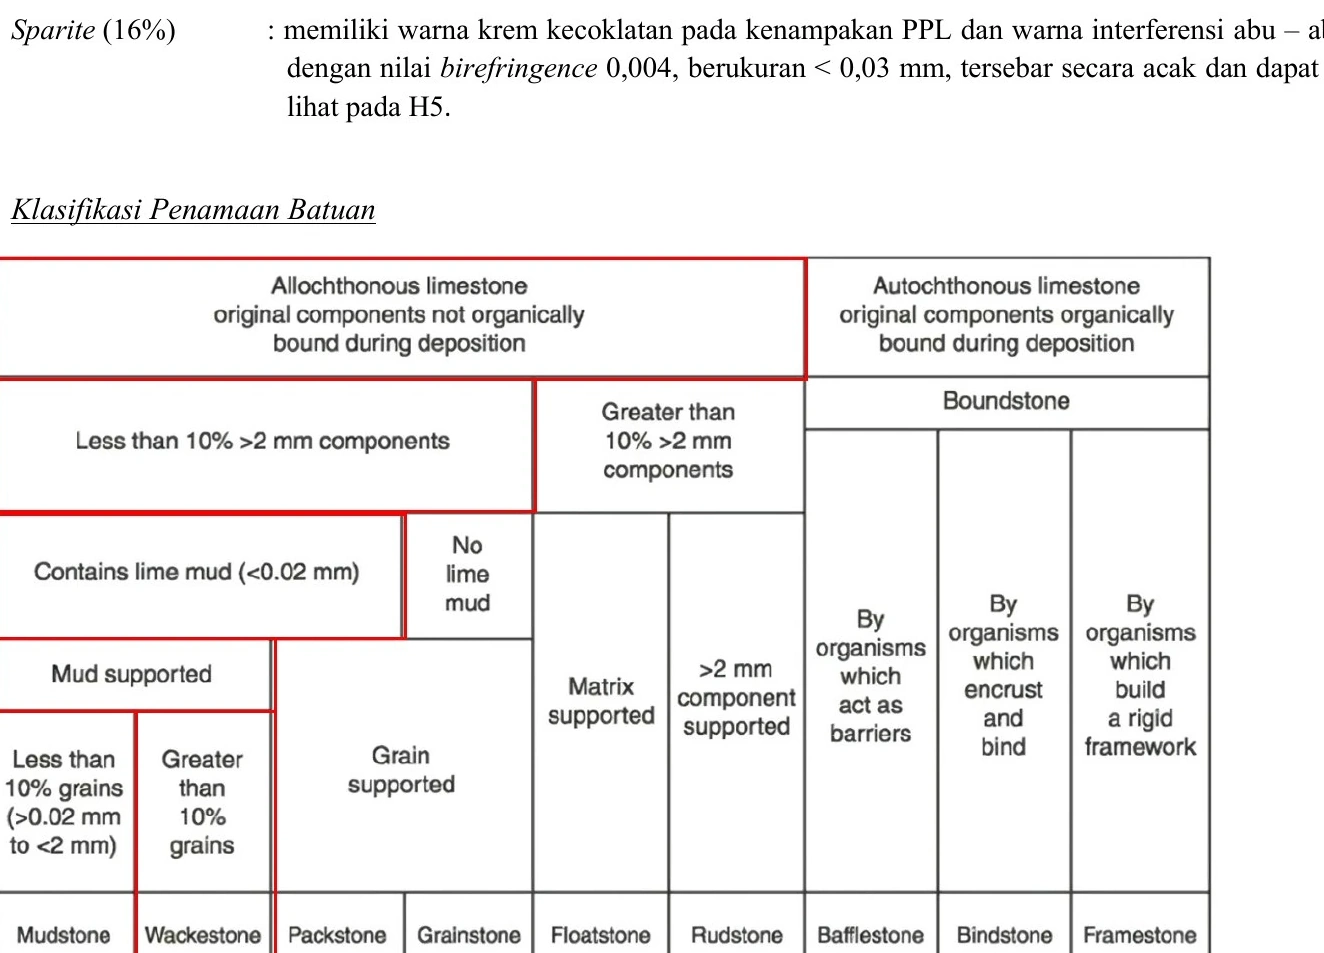
The Embry and Klovan classification table is a reference framework rather than a new observation. Its correct use requires deciding whether the rock is mud- or grain-supported, whether allochems exceed ten percent, whether components larger than two millimetres are significant and whether organisms bound the sediment during deposition. The plotted or selected wackestone field is consistent with the BG matrix-supported micrograph, but no classification chart can resolve a scale error or diagenetic overprint. The table is therefore most useful when the decision path is stated explicitly beside the modal data. Depositional-energy and reef interpretations should follow only after texture, taphonomy and field architecture are integrated.
appendix-11
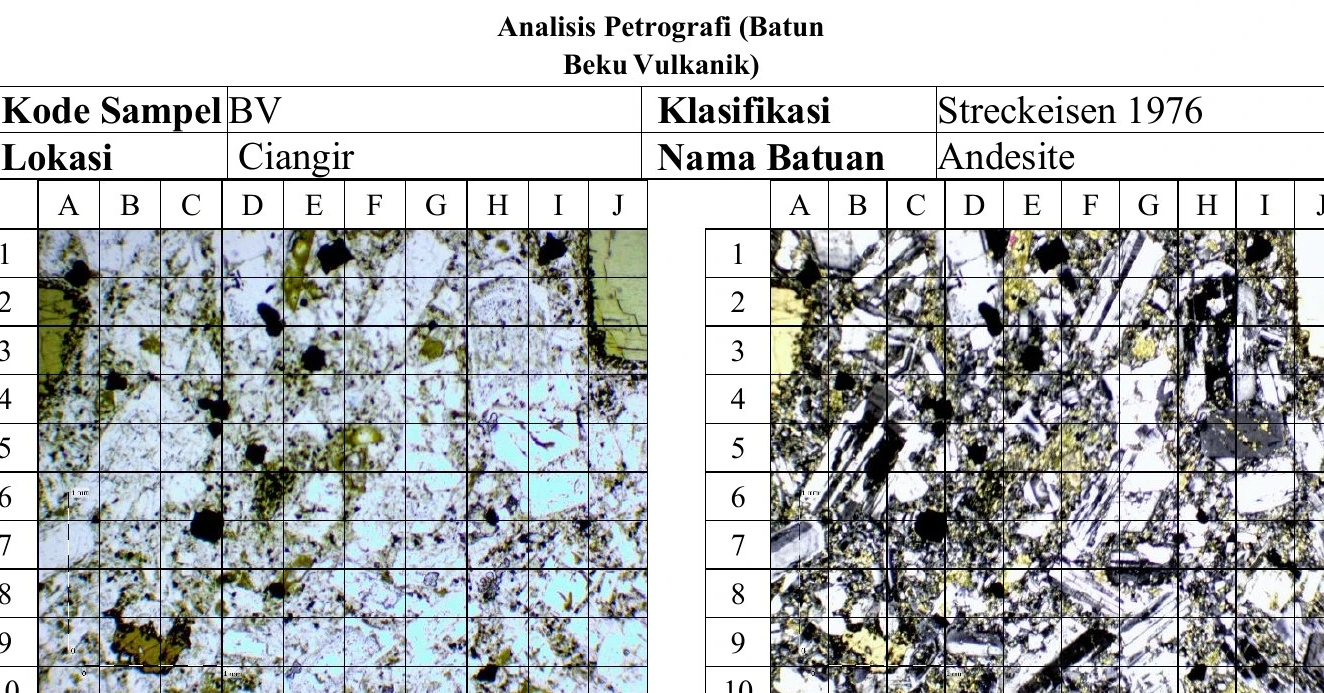
The BV micrograph shows a holocrystalline, porphyritic intermediate volcanic clast with plagioclase, hornblende, quartz, opaque minerals and a fine groundmass, plus weak sericitic alteration. A QAP-normalised composition near Q20-P75.5-A4.4 supports andesite under the cited Streckeisen framework, provided groundmass treatment and point-count method are documented. Zoning and intergranular relationships may constrain crystallisation history, but one clast cannot define the full volcaniclastic unit. Alteration can shift apparent feldspar proportions, and quartz identification should be verified. The appropriate inference is clast-scale andesitic provenance; formation-wide source composition requires replicate petrography across clast types, matrix and localities.
appendix-13
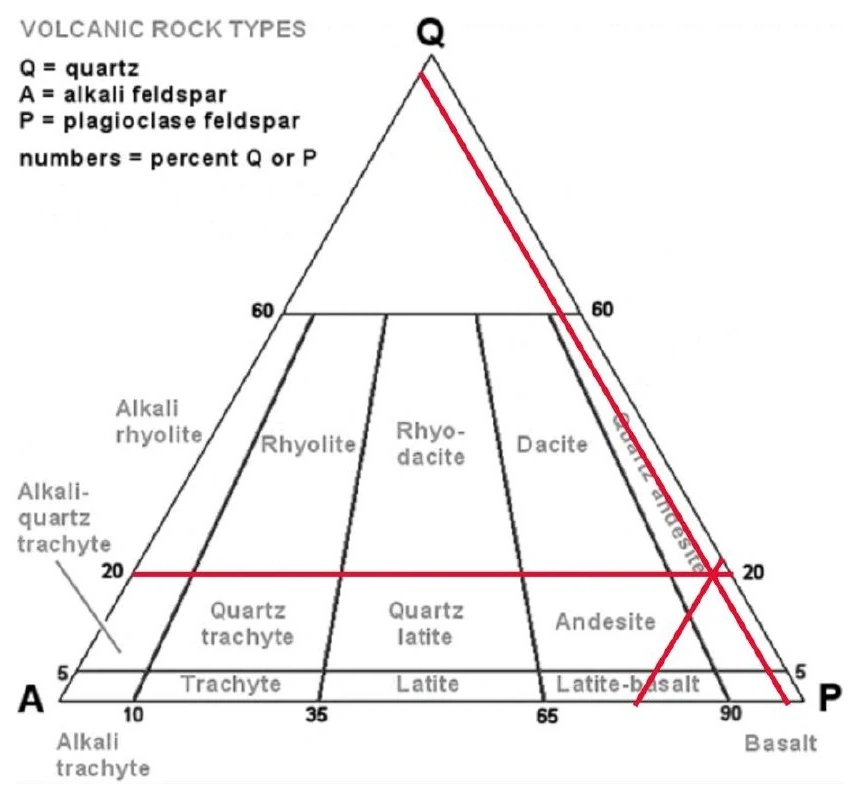
The QAP diagram transparently converts the BV modal framework-mineral proportions into an andesite classification. The plotted point is meaningful only after quartz, alkali feldspar and plagioclase are recalculated to 100 percent and after fine groundmass or altered material is treated consistently with the scheme. Analytical uncertainty should be propagated because a small counting change can move a point near a boundary, although this point appears well within the andesite field. The diagram corroborates the micrograph but does not independently verify mineral identification or sample representativeness. Its strongest use is reproducible nomenclature for the analysed clast, followed by comparison with additional clasts to test whether the coarse deposit is monomictic or polymictic.
appendix-14
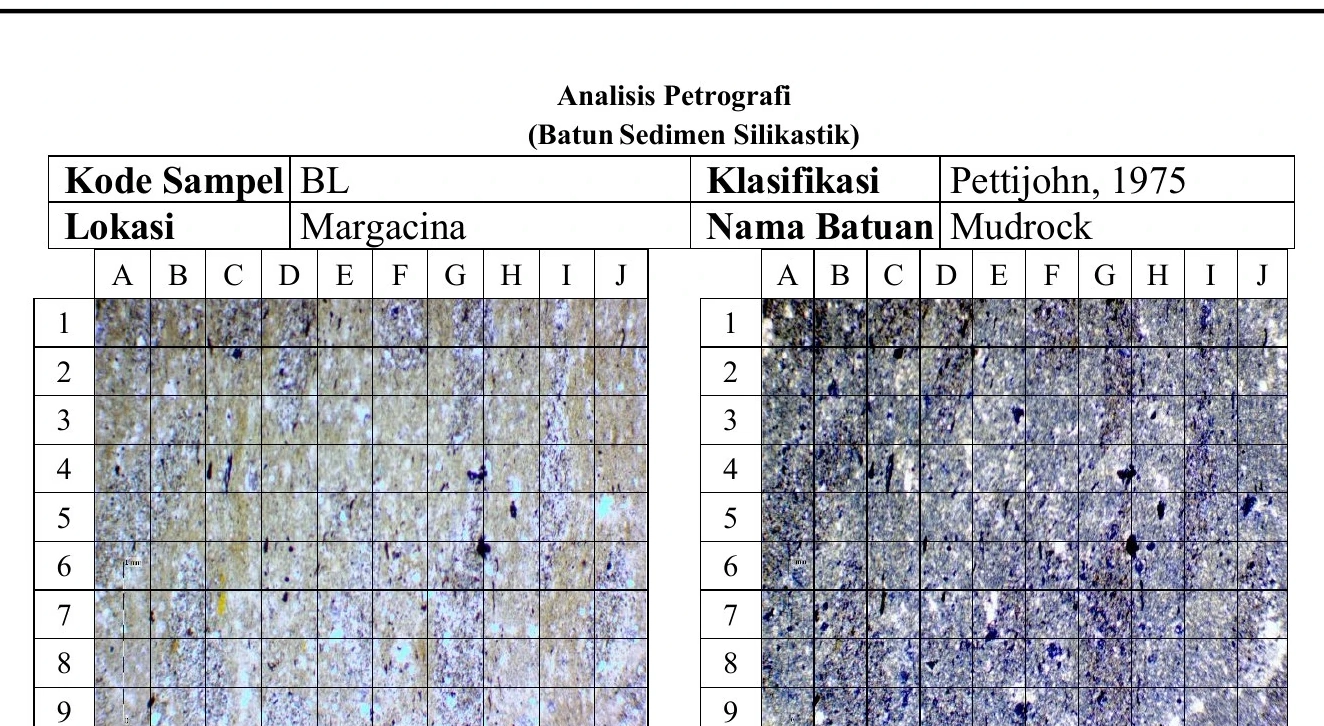
The BL micrograph is dominated by very fine clay-rich matrix and is classified as mudrock under the Pettijohn framework. The reported 81 percent matrix strongly supports that broad class, but routine optical petrography cannot identify clay mineral species reliably; XRD would be required for mineralogical resolution. Minor quartz, orthoclase, opaque grains and carbonate or clay cement should be separated from matrix through a documented point count, and fissility should be assessed at hand-specimen scale. The fabric is consistent with low-energy suspension deposition or distal sediment-gravity-flow fallout, yet depositional setting cannot be derived from matrix abundance alone. Bedding architecture, fossils and associated sandstone beds provide the necessary environmental context.
appendix-16
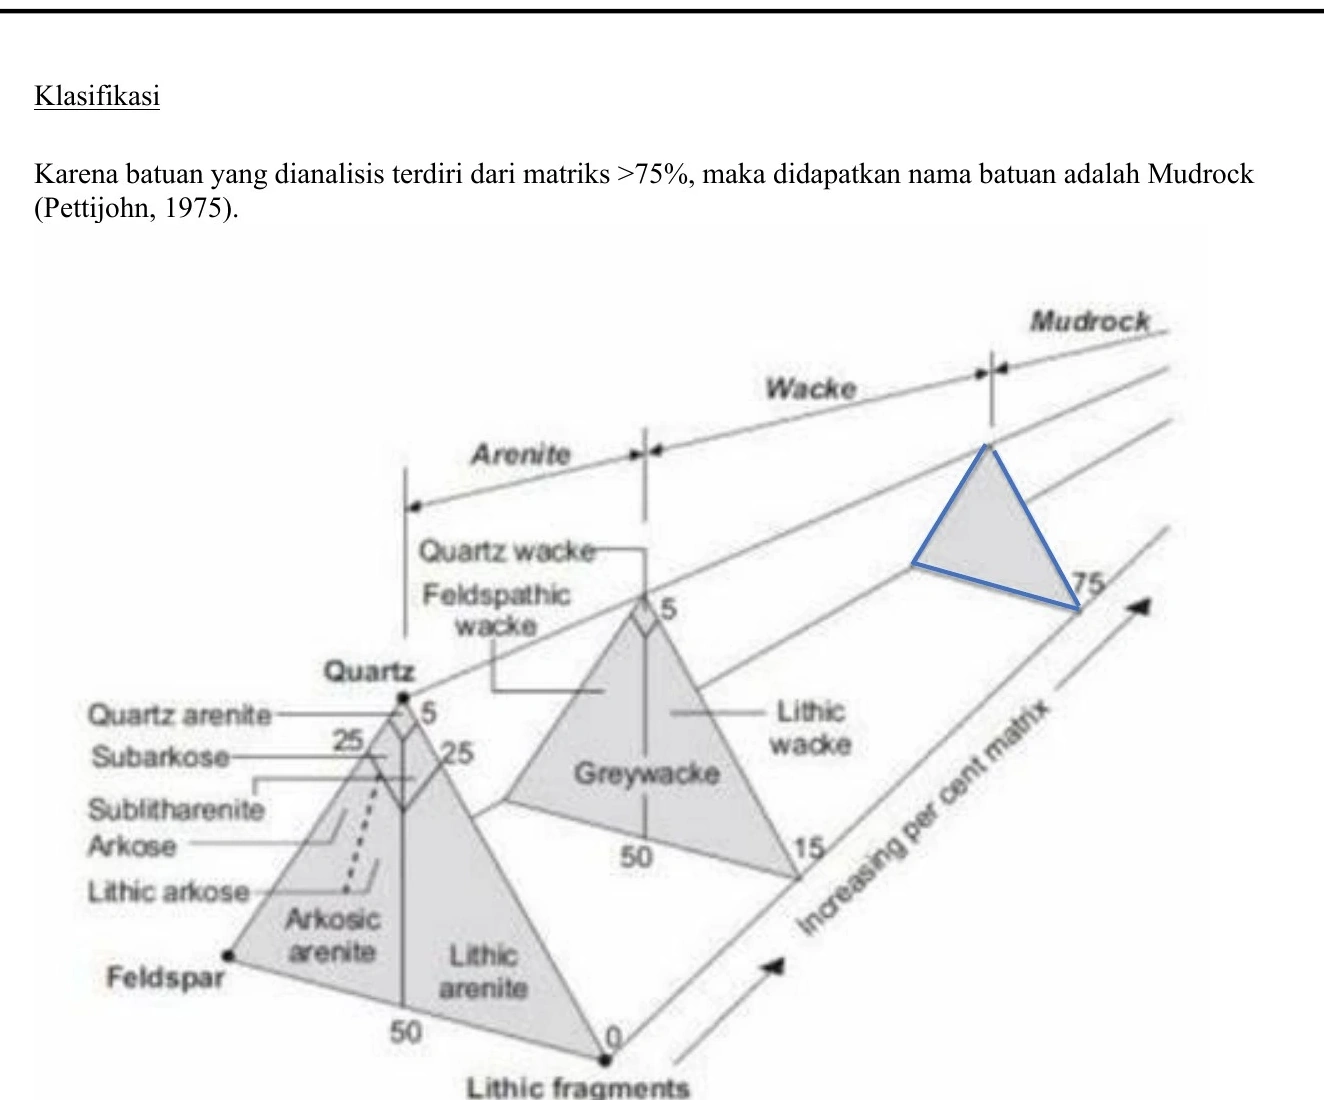
The Pettijohn ternary diagram places the BL sample in the mudrock field because matrix overwhelmingly exceeds the arenite–wacke threshold. This is a classification translation of the modal estimate, not an independent line of evidence. The plotted proportions should be traceable to a point count, with lithic fragments and feldspar distinguished consistently and the matrix definition stated. Because the point lies deep within the mudrock domain, modest counting uncertainty is unlikely to change the name, but it still affects quantitative comparisons among samples. The diagram supplies controlled terminology; process interpretation must rely on sedimentary structures, grain-size distributions, stratigraphic position and the regional deep-water facies association.
appendix-17
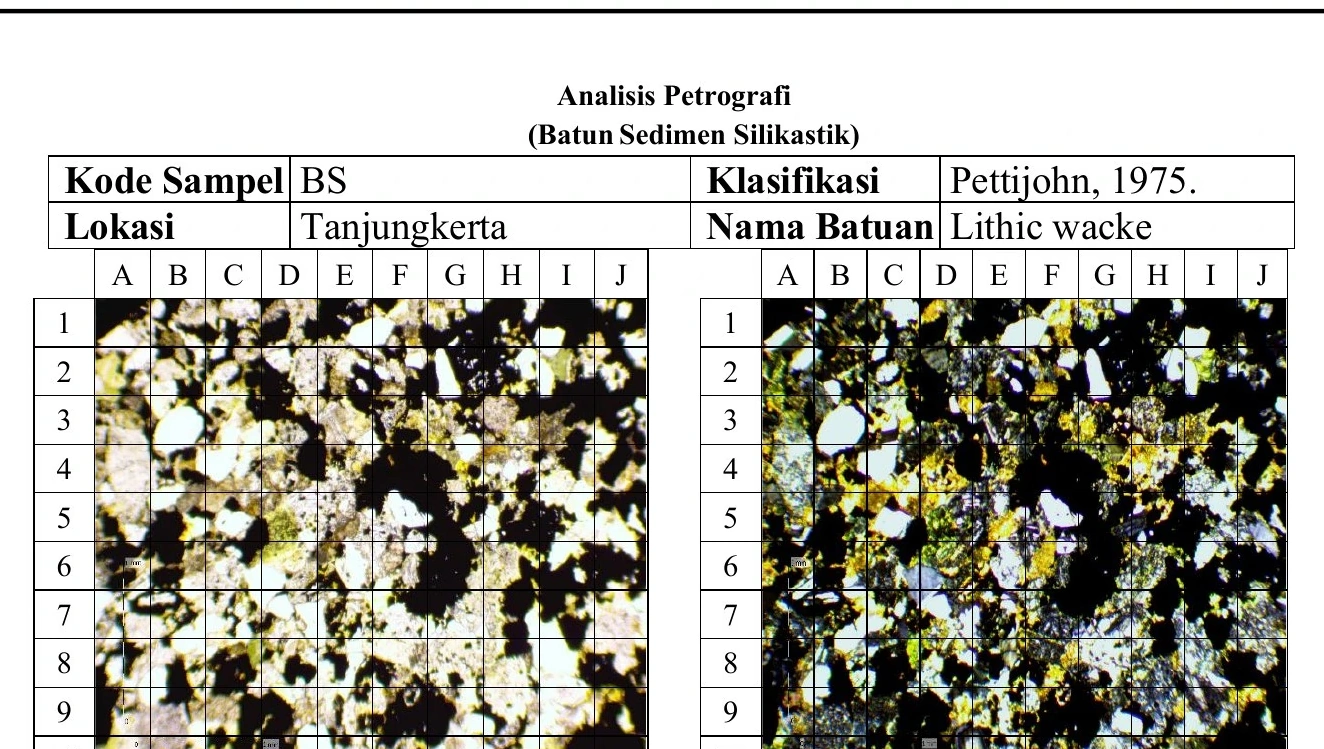
The BS micrograph is classified as lithic wacke and reportedly contains quartz, feldspar, sedimentary and volcanic lithic fragments, abundant opaques, chlorite, microquartz matrix, sericite and clay cement. Matrix near twelve percent places the sample close enough to a classification threshold that counting uncertainty and cement-versus-matrix distinction matter. Angular to subrounded grains and moderate-to-poor sorting suggest limited textural maturity, compatible with relatively rapid delivery, but do not identify a unique transport process. Provenance interpretation should separate altered volcanic fragments from matrix and verify the unusually high opaque fraction. The plate supports a compositionally immature sandstone whose tectonic and depositional meaning requires replicate samples and facies context.
appendix-19
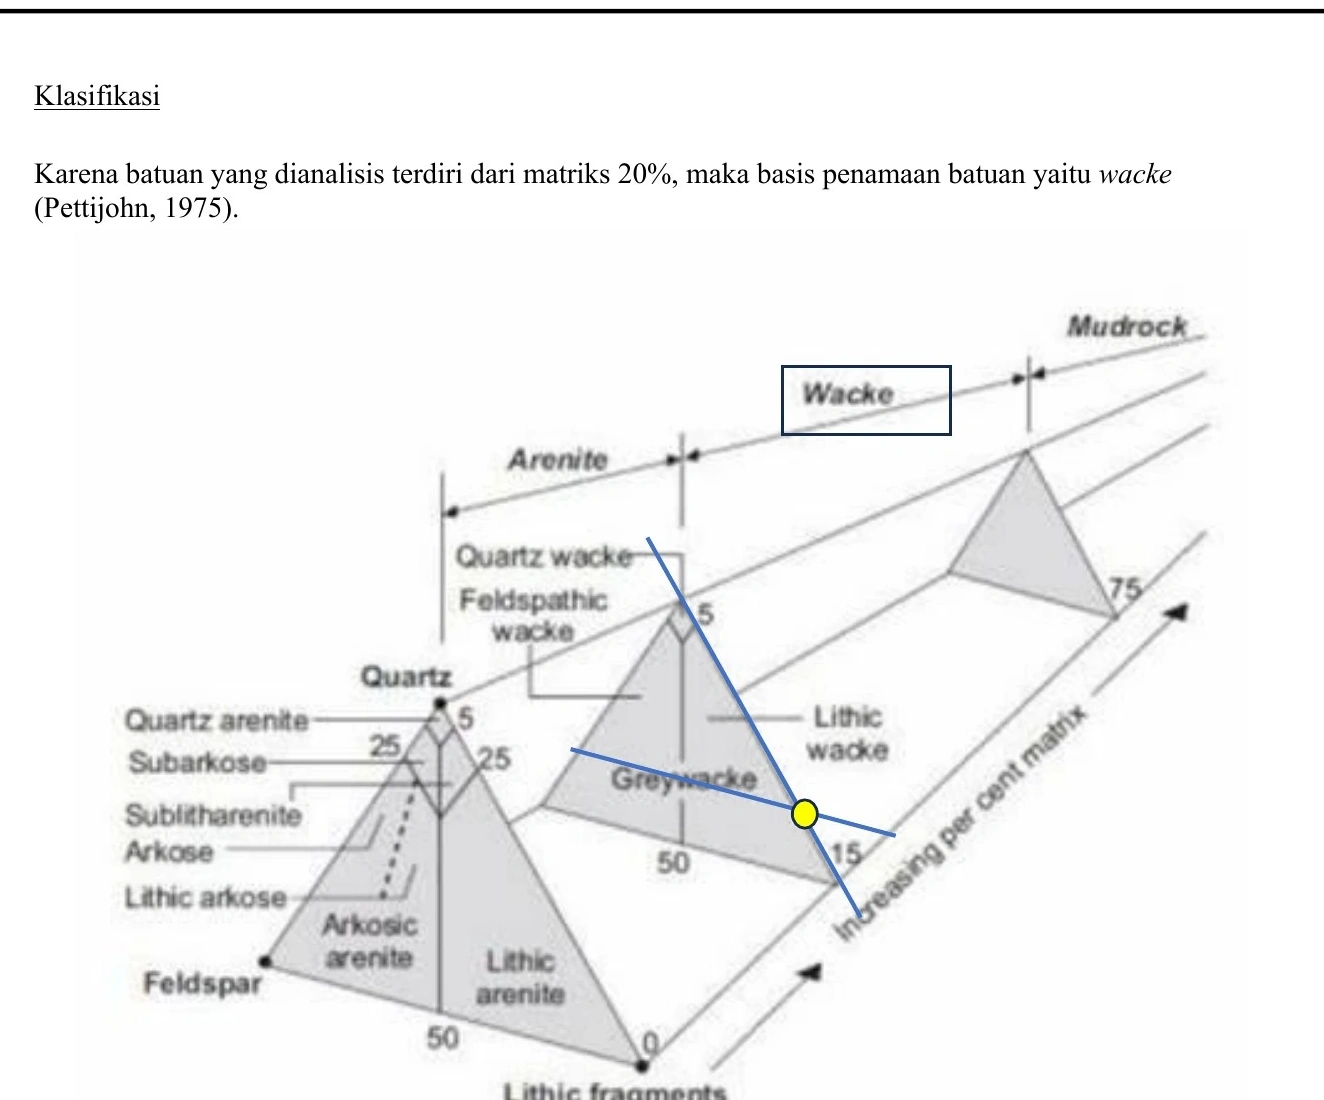
The Pettijohn diagram translates the BS proportions into the lithic-wacke field by combining framework composition with matrix content. Its location should be recalculated from the documented point count and accompanied by an error envelope, especially because matrix thresholds determine whether ‘wacke’ is appropriate. The relative lithic, feldspar and quartz fractions can inform provenance only after alteration, pseudomatrix and unstable fragments are handled consistently. The diagram therefore standardises nomenclature but does not establish source terrane or turbidite subenvironment by itself. Confidence rises when the plotted classification agrees with thin-section texture, hand-specimen description and multiple beds within a measured stratigraphic section.
SELECTED SOURCES
Evidence-integrity note: every project image is source-derived and retains its scientific colour and geometry. Warm large-format cinematic treatment is restricted to the interface and hero. No generative fill, synthetic geology, invented measurement or AI enlargement is used.